
LINK Weekly Analysis — A 107% Recovery Into the January Shelf: The $14.50 Poke Decides 16.23 or 10.62
Link ran 107% off 6.996 in 16 weeks and poked 14.50 into the January supply shelf. A weekly close above it opens 14.97 and 16.23; under 12.055 the ladder resets.
Sixteen weeks, 107%, and one ladder
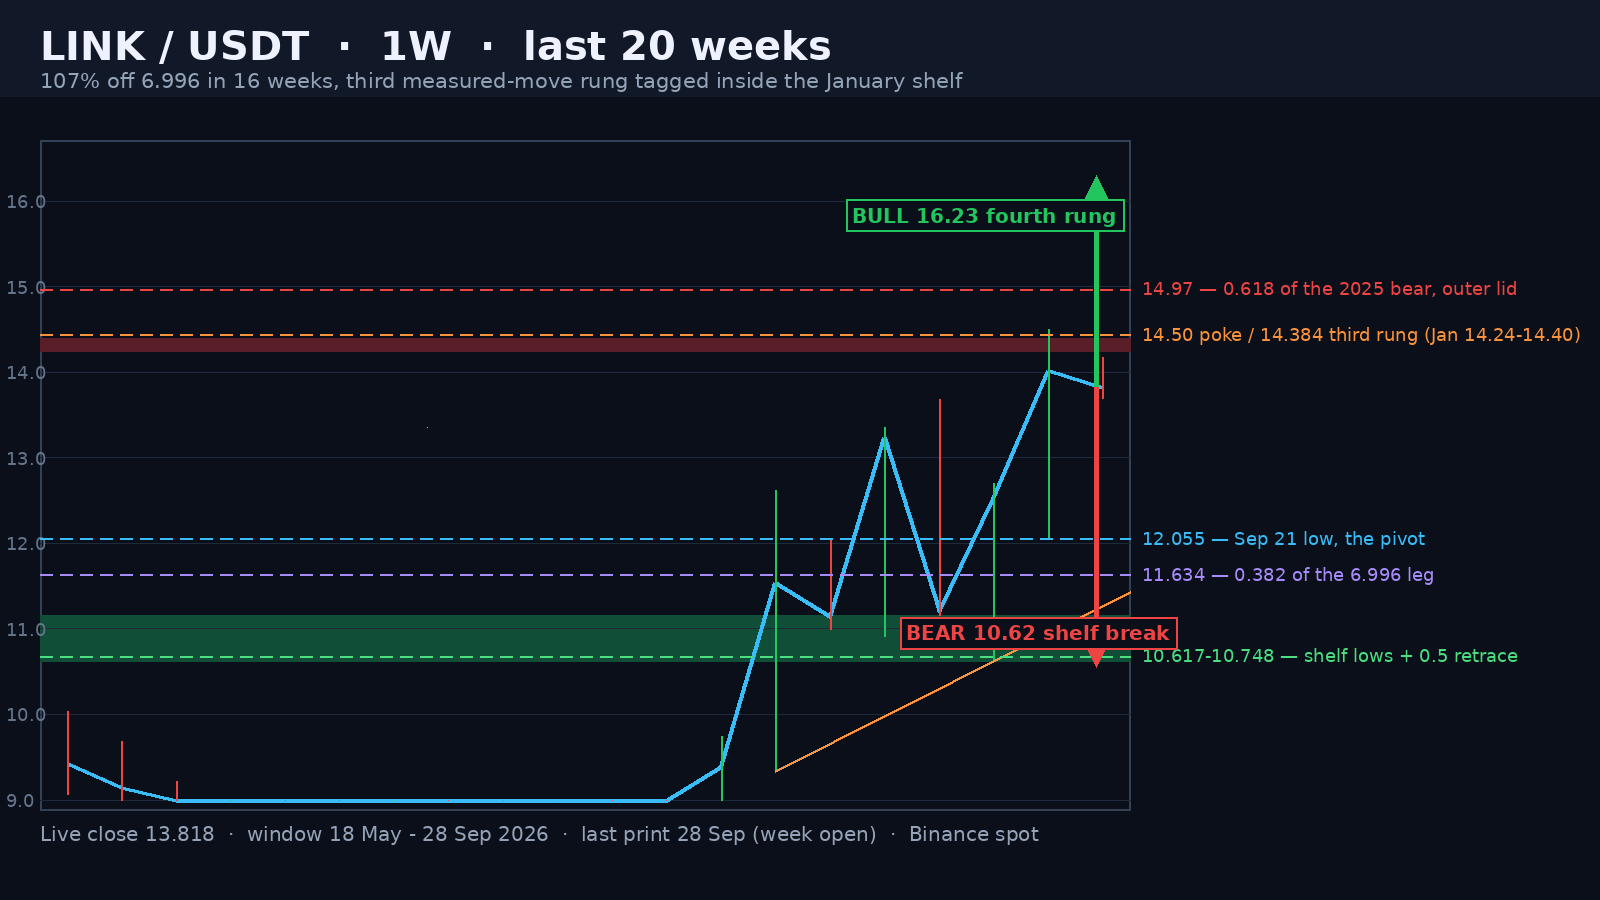
LINK closed the September 21 week at 14.024 — 100.5% above the 6.9960 low printed on June 1, 12.0% above the previous weekly close and the seventh consecutive weekly close above the 50-week average. The week's high of 14.50 was the highest weekly print since December 8, 2025, and it closed 0.476 under it.
The whole recovery is a ladder, and it is worth drawing because every target on this chart is measured from the same 1.8470 box. The June 1 low at 6.9960 and the June 22 low at 7.0100 sit 14 ticks apart, with the neckline at the July 20 high of 8.8430. That box then projected 10.690 (the August 17 week traded through it to 12.620), 12.537 (September 14 closed 12.5210 — 16 ticks under the count) and 14.384, which the September 21 week tagged by 0.116. A fourth rung sits at 16.231.
Advertisement
Volume tracked the ladder instead of fighting it: 15.74M on the August 10 week, 31.09M on the August 17 breakout (1.9x the twenty-week average), then 19.65M, 17.49M, 16.66M and 27.05M on the September 21 push (1.66x). The heaviest weeks of this move are the up weeks, and the only 15% down week — September 7 — was followed by two closes above the level it broke.
The January shelf is where it stopped
Above 14 there is five-month-old supply. The January 5 week printed a high of 14.24 and the January 12 week 14.40; back further, the December 8, 2025 week printed 15.01, July 2024 printed 15.196, and the 0.618 retracement of the entire August-2025-to-June-2026 decline (27.87 to 6.996) sits at 14.97. That is a dense band between 14.24 and 15.196 — and the September 21 weekly high at 14.50 stopped inside it.
Advertisement
The closing behaviour is what matters. The September 21 week closed 14.024, under the 14.24 base of the shelf and 0.476 under its own high; the current week opened at that same 14.024 and has printed 13.695-14.175 so far. The last weekly close above 14.024 was the November 3, 2025 week at 15.93 — 47 weeks ago. Until a weekly close lands above 14.50, this is a poke.
The staircase is what makes it credible
The lows are the strongest feature of this chart. The August 24, August 31 and September 7 weeks each bottomed inside a 0.25 band — 10.9920, 10.9080 and 11.1590 — and the September 14 week swept 0.131 under the 0.5 retracement of the recovery (10.7480) before closing 12.5210. Support and Fibonacci overlap for 0.54 inside that band, which is why the September 7 shakeout — a 15.35% down week — found buyers instead of turning into a breakdown.
The trend work supports it: seven consecutive weekly closes above the 50-week average at 10.7217, and no weekly close under the previous week's low since the week of August 17. The weekly RSI of 63.1 is hot without being stretched, and every moving average on the chart — the 20-week at 9.8223 and the 50-week at 10.7217 — sits below the price.
What the levels pay, in both directions
The bull case is arithmetic. A weekly close above 14.50 clears the shelf and puts 14.97 first, then 15.196 (the July 2024 high) and the fourth rung at 16.231. The realistic path is a first close above 14.50 that gets sold into 14.97, a pullback that holds 13.80-14.00, and a second attempt that closes through the Fibonacci — after which the market is in open air that has not traded since late 2025.
The bear case is cheaper to execute and needs less volume. A weekly close under 12.055 — the September 21 low — opens 11.634 (the 0.382 of the recovery) and then the three-touch shelf at 10.908-11.159 with the 0.5 at 10.748 inside it. Under 10.617, the September 14 low, the staircase is broken and 9.862 (the 0.618) plus the August 17 close at 9.39 become the honest objectives. The bull case survives a 12.055 retest; it does not survive a weekly close under 10.617.
The two closes that decide it
A weekly close above 14.50 invalidates the January-supply read and opens 14.97, 15.196 and 16.231; a weekly close below 12.055 invalidates the September leg and reopens 11.634 and the 10.748-11.159 shelf. Between those two lines the path of least resistance stays upward — seven closes above the 50-week average is not a market that is rolling over — but the 14.24-14.40 shelf has now been touched once and refused once, and that is how double tops start.
The asymmetry is thinner than it looks. The weekly ATR of 1.4599 is 10.6% of spot: this market delivers a week's worth of range inside a single candle, which is why 14.50 and 12.055 are the only two lines that will matter for as long as the range holds, and why a wick through either one is not a signal.
Sixteen weeks of rising lows and a measured move that has already paid three times is not a market that is out of ideas — it is one that has reached the first real supply since June. The level that decides this one is 14.50: close above it and 16.231 is the next rung, close below 12.055 and the ladder has to be re-measured from the 10.748 shelf.
The same measured-move method, with the count already filled, was the point of last week's LTC weekly analysis — and the daily read on this structure, published while the market was still coiling under 13.685, is here.
Chainlink is not moving alone in this rotation: ADA is proving the same ascending-base arithmetic and the second weekly name of this run, SUI's record-volume breakout, is the higher-beta version of the same bid.
Written by
EarnCrypto.dev Editorial
The EarnCrypto.dev editorial team researches and reviews AI mining platforms, pools and earning tools — publishing only what passes our own checks.
Related reading

SOL Weekly Analysis — A 17-Week Doubling Topped Twice at 124.95 / 123.76: The 116.32 Neckline Decides 124.95 or 100.19
SOL doubled 107.8% in 17 weeks into a 124.95 / 123.76 two-touch top and paid its 108.29 count to 105.71. The 116.32 neckline decides 124.95 or 100.19.

AVAX Weekly Analysis — A 55.2% Thrust and Four 2x-Volume Weeks Under a 12.008 Two-Touch Top: The 10.866 Retrace Decides 14.25 or 8.387
AVAX ran a 55.2% week on 2.27x volume, then coiled four weeks under an 11.799 / 12.008 two-touch top. The 10.866 line decides 14.25 or the 8.387 count.

ETH Daily Analysis — A 2,392.96 Count 94% Filled and Five Rising Lows Back at the 0.382: The 2,635 Line Decides 2,777 or 2,406
ETH's 2,807/2,600 distribution left a 2,392.96 count that went 94% filled at 2,406.11. Five rising lows have retaken the 0.382 — 2,635 decides 2,777 or 2,406.