
LINK Daily Analysis — Ascending Coil Under the $13.685 High: The 13.028 Retrace Decides 14.52 or 12.08
Chainlink is 2% under its 120-day high at $13.685 after a 27% recovery off the September low. The 13.028 retrace decides whether 14.52 or 12.08 comes next.
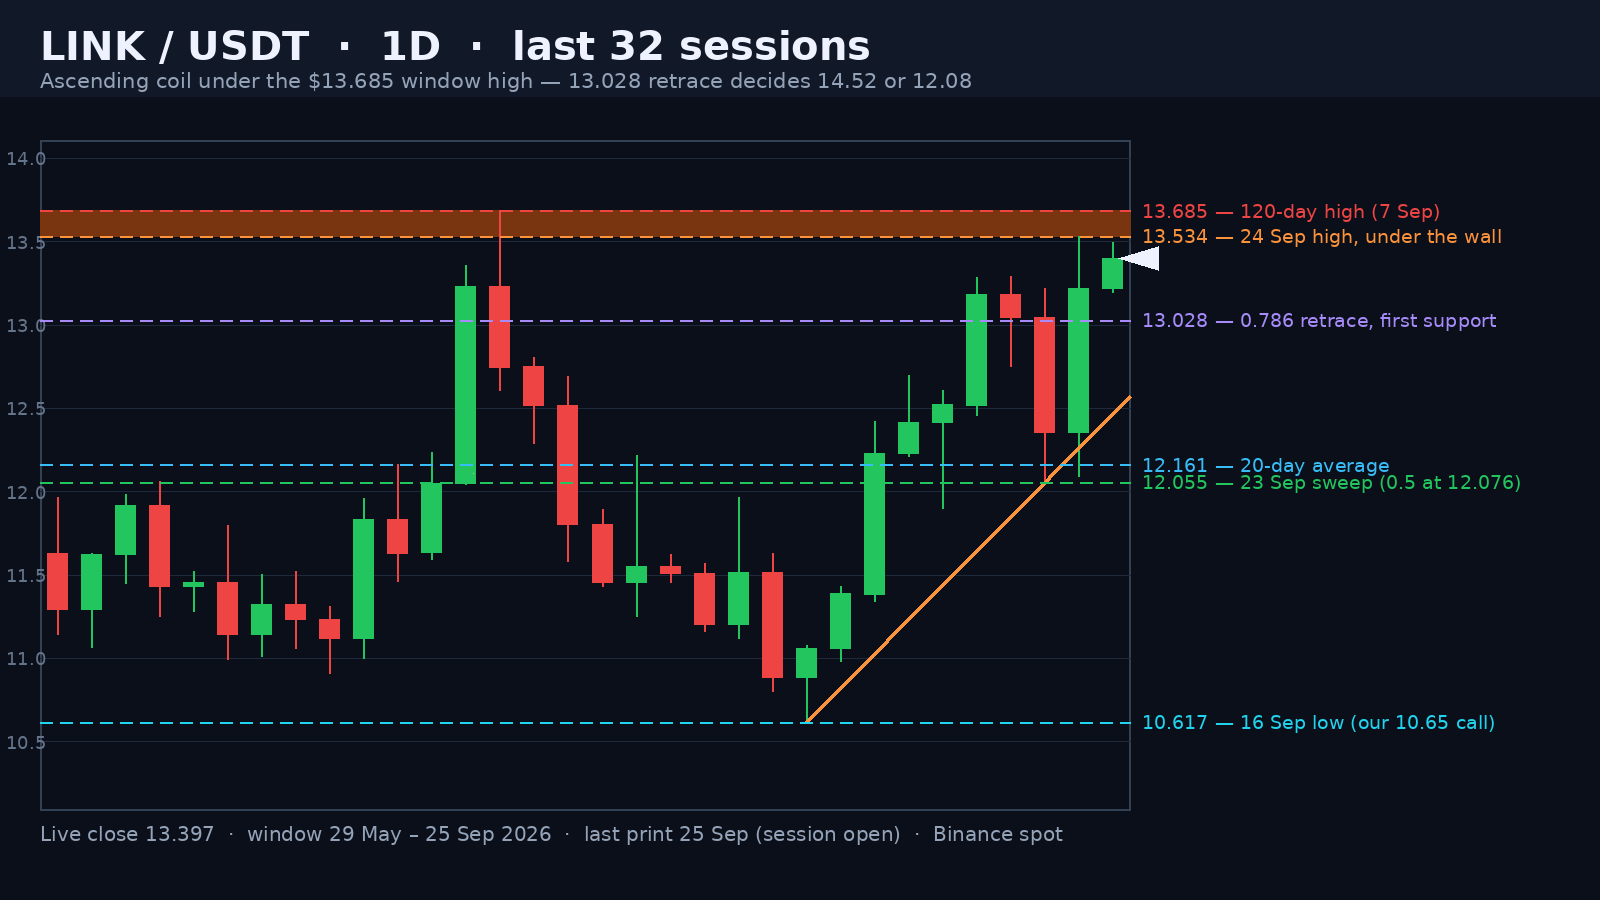
Chainlink is trading at 13.421 in the closing hours of the 25 September session, inside a 0.30-dollar range that runs from 13.195 to 13.495. That is a 2.24% span — the tightest of the last six sessions — on a 0.37x volume pace against the 20-day average of 2,803,373 LINK. Compression this narrow, -1.93% under the highest price of the 120 sessions on this chart, is the market holding its breath at a decision level.
From a 22% Drawdown to a 27% Recovery in Eight Sessions
The high that defines everything above was printed on 7 September at 13.685 — a candle that ran to that level and closed at 12.748, 6.9% under its own wick. The market then spent seven sessions unwinding it, and on 16 September it printed 10.617, a 22.42% drawdown from the peak. Our 13 September daily note on LINK set 10.65 as the bear target off the 0.786 of that decline; the market delivered 10.617, three cents through it, and turned. Eight sessions later the recovery reached 13.534 on 24 September, a 27.47% advance, and every one of the last eight closes has held above the 20-day average, now at 12.163.
Advertisement
The 23 September Sweep and the 0.5 That Held It
The candle that makes this structure credible is the one from 23 September. It opened at 13.047, swept down to 12.055 — a 9.43% range — and closed at 12.355, unwinding six sessions of gains in a single bar. The 0.5 retracement of the recovery leg sits at 12.0755, and the low stopped two cents above it. The very next session reversed the whole thing: a high of 13.534, a close at 13.221, a 10.89% range, and a reclaim of the 0.786 retracement of the September decline at 13.0284 on a closing basis. Two consecutive outside bars pointing in opposite directions, with the second one closing above the level the first one broke. That is the line that separates the two paths now.
Five Prints Inside 13.28 - 13.69
The wall above is not one candle. Since 7 September the market has printed highs at 13.685, then 13.284 on the 21st, 13.29 on the 22nd, 13.534 on the 24th and 13.495 today — five attempts inside a 40-cent band. The 13.534 and 13.29 prints are higher lows relative to each other, which is why this reads as a coil rather than a top, but a band with five touches is supply that has been tested, not guessed. It needs a daily close above its top before it can be called gone, and above 13.685 there is nothing in this window — the chart starts on 29 May at 9.022 and has never traded higher than that 7 September peak.
Advertisement
Two Measurements That Land on 15.00
The projections do not scatter. The September decline measured 3.068 points from 13.685 to 10.617; its 1.272 extension sits at 14.52 and the 1.618 at 15.58. The recovery leg from 10.617 to 13.534 measured 2.917 points, and projected from the 23 September low of 12.055 it targets 14.97. The flag's own depth — 12.055 to 13.534, or 1.479 points — measured from the 13.534 high gives 15.01. Two independent methods, four cents apart. So the ladder reads 13.534, then 13.685, then 14.52 as the first objective, with the measured-move cluster at 15.00 as the extension if the break holds.
Scenarios and the Invalidation
Above, a close through 13.534 opens 13.685, and a close above 13.685 opens 14.52. Below, 13.0284 is the first line, then 12.4197 — the 0.382 of the recovery — and then the 12.0550-12.0755 flag floor with the 20-day at 12.163 sitting on top of it. A daily close below 12.055 cancels the recovery and puts 11.433 (the 10 September low and the three-touch shelf from our earlier notes) and 10.617 back in play. Both invalidation lines are exact: the bear case dies on a close above 13.685, the bull case dies on a close below 12.055.
Five highs inside forty cents is tested supply, not imagined supply. I want a daily close above 13.534 before I treat that wall as gone, and 13.028 as the line that keeps the recovery honest.
Two numbers argue for patience rather than a chase. RSI(14) is 64.2 — firm, not stretched — while price sits 10% above its 20-day average at 12.163 and 21% above the 50-day at 11.112, and the 14-day ATR has widened to 0.72, or 5.4% of spot. A market that averages a 5.4% daily range does not respect 40-cent bands for long. The volume argues the same way: the two outside bars traded 4.30M and 3.66M against a 2,803,373 average, so the tape is expanding at the decision level rather than drying up.
The path of least resistance stays higher while 13.03 holds on a closing basis, and the 13.534-13.685 band is the gate — but a coil with five touches above it resolves either way, and the honest lean is closer to 60/40 than to a forecast. Watch two lines: 13.534 above, 12.055 below.
Binance LINK/USDT live chartOur 13 September LINK note on the 10.65 targetChainlink market data on CoinGeckoWritten by
EarnCrypto.dev Editorial
The EarnCrypto.dev editorial team researches and reviews AI mining platforms, pools and earning tools — publishing only what passes our own checks.
Related reading

SOL Weekly Analysis — A 17-Week Doubling Topped Twice at 124.95 / 123.76: The 116.32 Neckline Decides 124.95 or 100.19
SOL doubled 107.8% in 17 weeks into a 124.95 / 123.76 two-touch top and paid its 108.29 count to 105.71. The 116.32 neckline decides 124.95 or 100.19.

AVAX Weekly Analysis — A 55.2% Thrust and Four 2x-Volume Weeks Under a 12.008 Two-Touch Top: The 10.866 Retrace Decides 14.25 or 8.387
AVAX ran a 55.2% week on 2.27x volume, then coiled four weeks under an 11.799 / 12.008 two-touch top. The 10.866 line decides 14.25 or the 8.387 count.

ETH Daily Analysis — A 2,392.96 Count 94% Filled and Five Rising Lows Back at the 0.382: The 2,635 Line Decides 2,777 or 2,406
ETH's 2,807/2,600 distribution left a 2,392.96 count that went 94% filled at 2,406.11. Five rising lows have retaken the 0.382 — 2,635 decides 2,777 or 2,406.