
AVAX Weekly Analysis — A 55.2% Thrust and Four 2x-Volume Weeks Under a 12.008 Two-Touch Top: The 10.866 Retrace Decides 14.25 or 8.387
AVAX ran a 55.2% week on 2.27x volume, then coiled four weeks under an 11.799 / 12.008 two-touch top. The 10.866 line decides 14.25 or the 8.387 count.
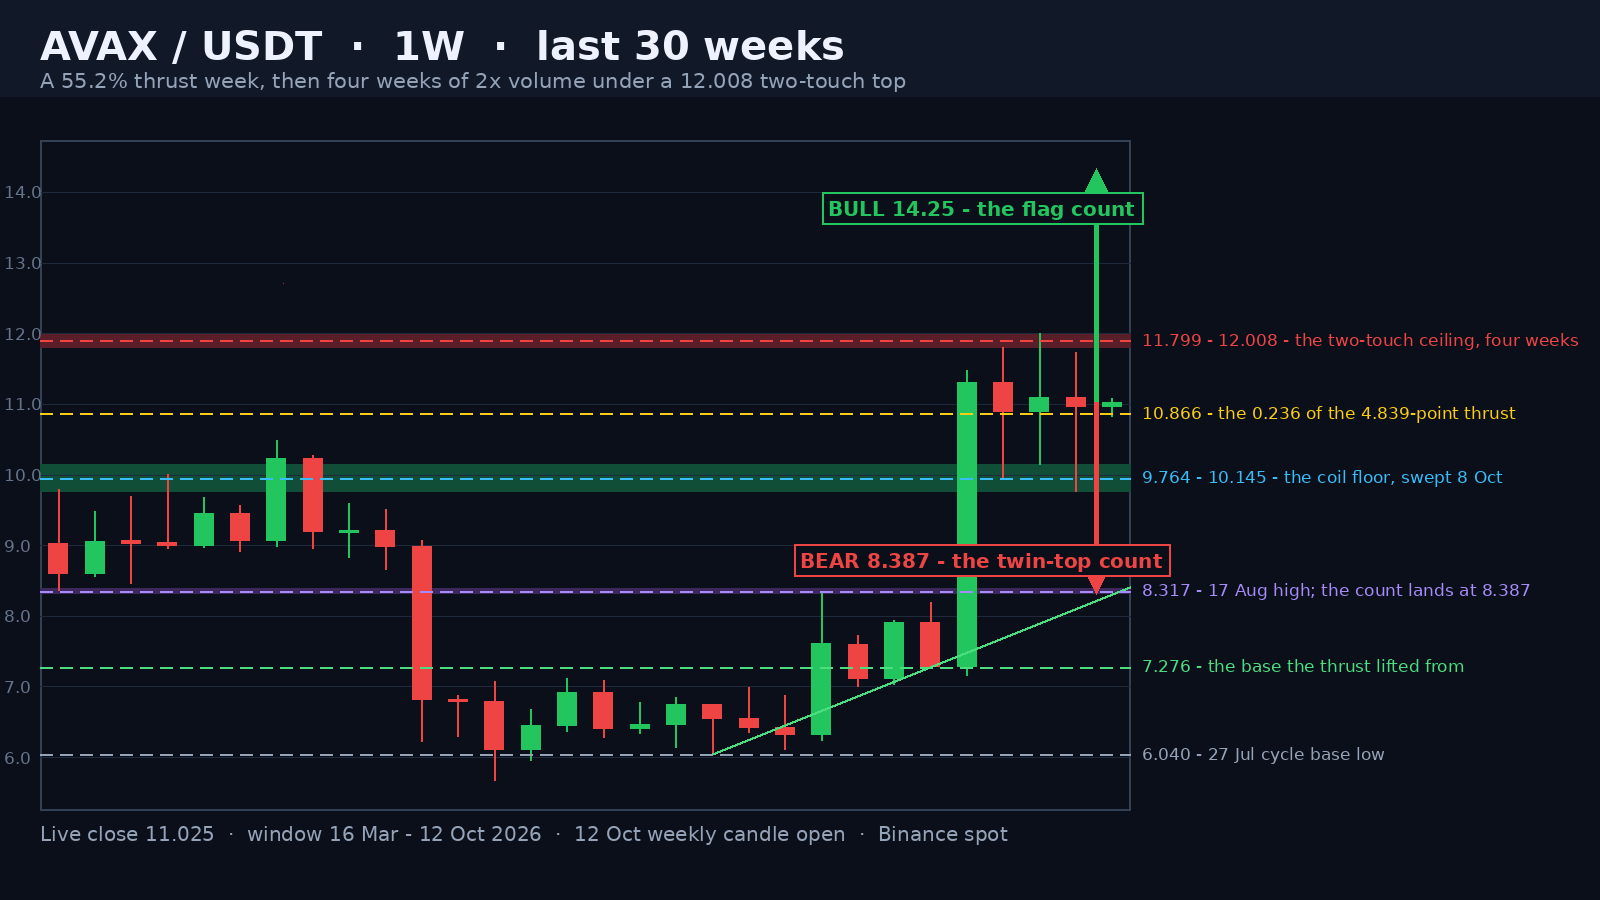
AVAX closed the week of 5 October at 10.976 and is trading 11.039 in the first hours of the 12 October week — 80.2% under the 55.79 high the 2 December 2024 week printed, 94.0% above the 5.681 cycle low of 15 June 2026, and 8.2% under the 12.008 high of 29 September. The last nine weekly candles are the most violent sequence on the chart since the top: an eight-week base between 6.04 and 7.28, a 55.2% thrust week on 2.27x volume, and then four weeks that have refused to give any of it back.
An Eight-Week Base, Then a 55.2% Week on 2.27x Volume
The base is easy to miss because it was so quiet. From the week of 27 July to the week of 7 September AVAX closed between 6.407 and 7.908 eight times in a row and printed a 6.040 low that never got a second look. The week of 14 September broke it in one candle: a 7.291 open, a 7.169 low, an 11.474 high, an 11.313 close — +55.2%, on 39.52 million AVAX against a 17.44 million median, across 3.46 million trades. That 11.474 print is the highest weekly high since the week of 19 January 2026. What matters more is what came after: 39.82, 37.51 and 29.43 million AVAX in the three following weeks — 2.28x, 2.15x and 1.69x the median, and the 5th, 6th and 7th heaviest weeks of the entire 120-week window. The heaviest of them, the week of 21 September, is the largest weekly volume since the week of 6 October 2025.
Advertisement
A Two-Touch Ceiling at 11.799 and 12.008
Two weekly highs 1.8% apart, over the same floor, on the same heavy volume: 11.799 on 21 September and 12.008 on 28 September — two points above the round 12.00. The second one was rejected in nine days. The 5 October week printed 11.730, a lower high, then lost 9.764 on 8 October, and still closed the week at 10.976. Three consecutive weekly closes have landed inside a 1.8% band — 10.905, 11.103, 10.976 — which is what absorption looks like, and also exactly what a two-touch top looks like before it fails.
The Retrace Says 10.866
The thrust ran 4.839 points from the 7.169 low of the breakout week to the 12.008 high. Its 0.236 is 10.866, the 0.382 is 10.159, the 0.5 is 9.589 and the 0.618 is 9.018. The 8 October flush reached 9.764 — 46.4% of the thrust — and stopped 175 points above the 0.5 before the week closed back at 10.976. The current week has printed a 10.835 low, 31 points under the 0.236, and trades 11.02. A market that gives back less than a quarter of a 55% week while trading four weeks at 1.7x to 2.3x volume is holding, not folding.
Advertisement
The Bull Case: 2.244 Points From 12.008
The flag is 2.244 points tall, from the 9.764 sweep low to the 12.008 ceiling. A weekly close above the ceiling projects 14.25 — which is exactly the 29 December 2025 weekly close, so the count and a real print agree. Above 12.008 the first rungs are the 12.29 high of 26 January and the 12.64 open of the 29 December week; beyond them 13.35, 14.25, and the 14.95 high of 12 January 2026 closes the shelf. Expect the path to be ugly: a wick through 12.008, a retest of 11.30 to 11.50, and only then a close. This case is cancelled by a weekly close under 9.764, and the whole thrust is void under the 7.276 base.
The Bear Case: 8.387 on a Close Under 10.145
The two-touch top measures 1.759 points from the 11.904 mean of the peaks to the 10.145 floor, a target of 8.387. That lands 70 points from the 17 August breakout-week high at 8.317, which is not a coincidence: it is where the last sellers before the thrust were offered paper. The bear needs a weekly close under 10.145 first. 9.764 is the tripwire, and 9.589 and 9.018 are the rungs after it. Under 8.317 the entire 6.04 to 7.28 base comes back into play. A weekly close above 12.008 cancels this path.
Where the Odds Sit
This is a 55/45 market, tilted to the bulls by volume rather than price. Four weeks of 1.7x to 2.3x volume directly under a ceiling is the signature of absorption, and a 46.4% retrace of a 55% week is shallow. Against it: a two-touch top, a round number at 12.00, and the fact that the last four weekly highs have gone 11.799, 12.008, 11.730, 11.089. Lower highs are still lower highs. The tell is simple. A weekly close above 12.008 on 1.7x volume or better confirms the flag. A weekly close under 10.145 on more than 1.5x volume turns the whole nine-week sequence into a bull trap.
The levels, in order. Above: 11.089 is this week's high, 11.474 the breakout-week high, 11.799 and 12.008 the two-touch ceiling, and 14.25 the flag count. Below: 10.866 (the 0.236), 10.145 (the 28 September weekly low), 9.764 (the 8 October flush), 9.589, 9.018, 8.387 (the count), 8.317 and 7.276 as the line that makes the whole nine weeks a failure. AVAX is 80% under its 2024 high and 94% above its June low. This is a two-sided battle inside a four-week range, not a trend.
Written by
EarnCrypto.dev Editorial
The EarnCrypto.dev editorial team researches and reviews AI mining platforms, pools and earning tools — publishing only what passes our own checks.
Related reading

SOL Weekly Analysis — A 17-Week Doubling Topped Twice at 124.95 / 123.76: The 116.32 Neckline Decides 124.95 or 100.19
SOL doubled 107.8% in 17 weeks into a 124.95 / 123.76 two-touch top and paid its 108.29 count to 105.71. The 116.32 neckline decides 124.95 or 100.19.

ETH Daily Analysis — A 2,392.96 Count 94% Filled and Five Rising Lows Back at the 0.382: The 2,635 Line Decides 2,777 or 2,406
ETH's 2,807/2,600 distribution left a 2,392.96 count that went 94% filled at 2,406.11. Five rising lows have retaken the 0.382 — 2,635 decides 2,777 or 2,406.
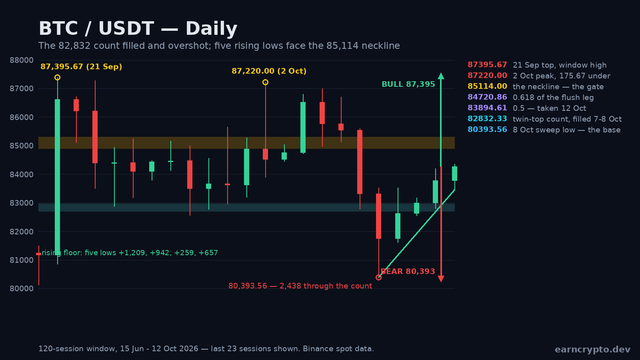
BTC Daily Analysis — Five Rising Lows After the 82,832 Count Filled and Overshot by 2,438: The 85,114 Neckline Decides 87,395 or 80,393
BTC's 87,395/87,220 twin top delivered its 82,832 count and overshot it by 2,438. Five rising lows have retaken the 0.5 — 85,114 decides 87,395 or 80,393.