
BTC Daily Analysis — Five Rising Lows After the 82,832 Count Filled and Overshot by 2,438: The 85,114 Neckline Decides 87,395 or 80,393
BTC's 87,395/87,220 twin top delivered its 82,832 count and overshot it by 2,438. Five rising lows have retaken the 0.5 — 85,114 decides 87,395 or 80,393.
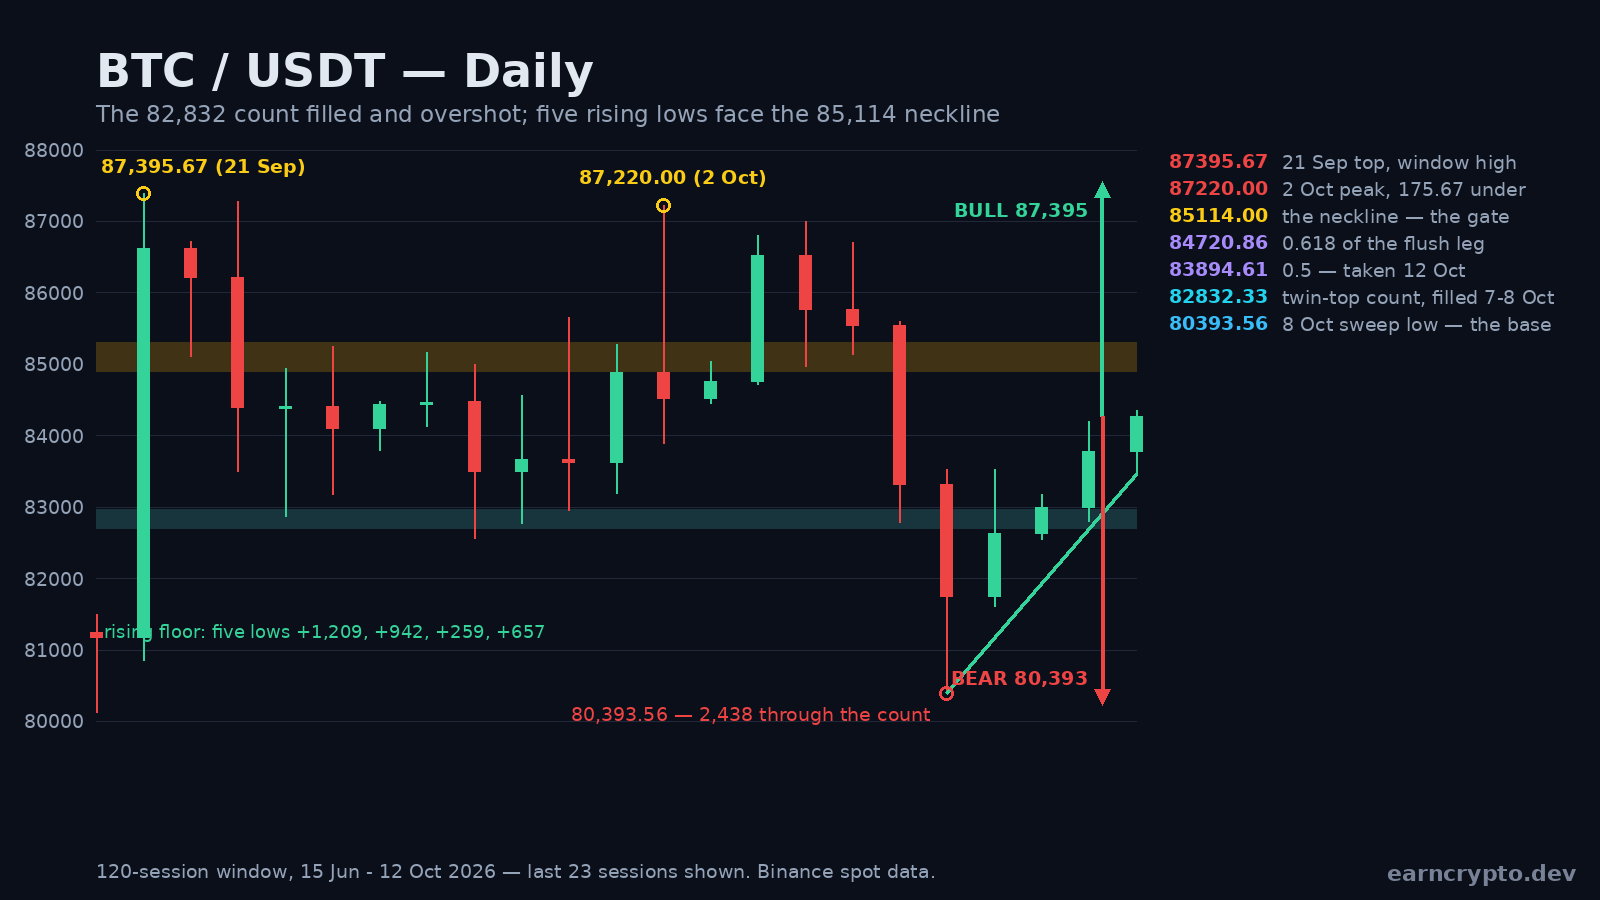
Bitcoin printed 80,393.56 on 8 October and closed the session at 81,754.45 — the deepest print of the correction and the widest tape of it, 21,677 BTC against a twenty-day average of 15,351. That low finished 2,438.77 points below the 82,832.33 measured move the twin top at 87,395.67 / 87,220.00 had been pointing at since the neckline broke.
What has followed is five sessions of higher lows and higher closes. Today's close of 84,215.99 sits 321.38 above the 0.5 retracement of the whole flush at 83,894.61, and it is the first close back above the twenty-day mean at 84,166.90 since 6 October.
Advertisement
The Twin Top's Count Is Done
The pattern is arithmetic. Two peaks 175.67 apart: 87,395.67 on 21 September on 31,963 BTC, and 87,220.00 on 2 October on 26,498. Between them the 22 September low at 85,114.00 set the neckline, and 87,395.67 minus 85,114.00 is 2,281.67 points.
Projected down from the neckline that count lands at 82,832.33. The 7 October session took it by 45.08 and closed at 83,321.81; the 8 October candle opened at that same 83,321.81, printed 80,393.56 — 2,438.77 through the target — and closed 1,077.88 under it. A measured move that is delivered in full and then overspent is not a forecast any more — it is inventory that has changed hands, and the sellers who had the level in mind no longer have the trade.
Advertisement
Five Sessions, Five Higher Lows
Since the low, every session has closed above the one before it: 81,754.45, 82,635.55, 82,988.36, 83,773.12 and 84,215.99 today. The lows have climbed 80,393.56, 81,603.52, 82,545.82, 82,804.65 and 83,462.00 — four steps of +1,209.96, +942.30, +258.83 and +657.35, an average of 767.11 points a session.
The 9 October candle is the one that set the tone: it opened at 81,754.46, printed 81,603.52 and finished at 82,635.55 — 881.09 points, 1.08% above its own open. The four closes since have held a 1,630.59-point band between that 82,635.55 and today's 84,215.99, with the lows doing all of the work. That is what a market looks like when it is absorbing a flush rather than running from it.
Walking the Retracement Ladder
The flush from 87,395.67 to 80,393.56 is 7,002.11 points tall. Its rungs sit at 82,046.06 (0.236), 83,068.37 (0.382), 83,894.61 (0.5), 84,720.86 (0.618) and 85,897.22 (0.786).
Price has taken them in order: the 0.236 on 9 October (close 82,635.55), the 0.382 on 11 October (83,773.12), and today's close took the 0.5 — 321.38 above it — while the session high of 84,352.00 stopped 368.86 short of the 0.618 at 84,720.86. Above that rung the tape is empty until the 5 October high at 86,999.11 and the twin top itself: the 85,114.00 neckline is the only structure left between 84,215.99 and 87,220.00.
What the Neckline Decides
85,114.00 is the line that matters now. It was the 22 September low, it framed both peaks, and the market closed above it three times (86,530.00 on 4 October, 85,766.87 on 5 October, 85,549.93 on 6 October) before giving it back in a single session on the 7th. A close back above it does not repair the double top — it invalidates the resolution, and puts the 86,698.99 – 86,999.11 cap cluster back in play with the September top above it.
The bear side is narrower than it looks. Under today's 83,462.00 the five-session floor is broken, and the next references are 82,804.65, then the 82,832.33 count — a level that has already been traded through once and is not support by default. Below that, 80,393.56 is the only shelf before the 5 September low at 79,442.00 and the 10 September low at 76,464.00.
The Participation Caveat
RSI(14) at 53.4 has recovered to the middle of the range without becoming overbought, and ATR(14) at 1,923.50 is 2.28% of spot — an ordinary session is smaller than the 847.86 points to the neckline, so the first rung is one day's work and the second is not.
The tape is the honest caveat. Today's 3,248 BTC is a 0.21x pace against the twenty-day average of 15,351, and the heaviest session since the flush was 12,302 on 9 October — the day the bounce started. This is a recovery of price without a recovery of participation, and it is why the lean is a 55/45 split toward the 0.618 and the neckline rather than a straight line to the top.
Two peaks, one neckline and a 2,281.67-point count that was delivered in full and then overspent by 2,438.77. Five sessions later the market has taken back the middle of its own flush and sits 847.86 under the 85,114.00 neckline. The recovery is real; the participation is not.
Charts for the same window: , and .
Written by
EarnCrypto.dev Editorial
The EarnCrypto.dev editorial team researches and reviews AI mining platforms, pools and earning tools — publishing only what passes our own checks.
Related reading

SOL Weekly Analysis — A 17-Week Doubling Topped Twice at 124.95 / 123.76: The 116.32 Neckline Decides 124.95 or 100.19
SOL doubled 107.8% in 17 weeks into a 124.95 / 123.76 two-touch top and paid its 108.29 count to 105.71. The 116.32 neckline decides 124.95 or 100.19.

AVAX Weekly Analysis — A 55.2% Thrust and Four 2x-Volume Weeks Under a 12.008 Two-Touch Top: The 10.866 Retrace Decides 14.25 or 8.387
AVAX ran a 55.2% week on 2.27x volume, then coiled four weeks under an 11.799 / 12.008 two-touch top. The 10.866 line decides 14.25 or the 8.387 count.

ETH Daily Analysis — A 2,392.96 Count 94% Filled and Five Rising Lows Back at the 0.382: The 2,635 Line Decides 2,777 or 2,406
ETH's 2,807/2,600 distribution left a 2,392.96 count that went 94% filled at 2,406.11. Five rising lows have retaken the 0.382 — 2,635 decides 2,777 or 2,406.