
SOL Weekly Analysis — A 17-Week Doubling Topped Twice at 124.95 / 123.76: The 116.32 Neckline Decides 124.95 or 100.19
SOL doubled 107.8% in 17 weeks into a 124.95 / 123.76 two-touch top and paid its 108.29 count to 105.71. The 116.32 neckline decides 124.95 or 100.19.
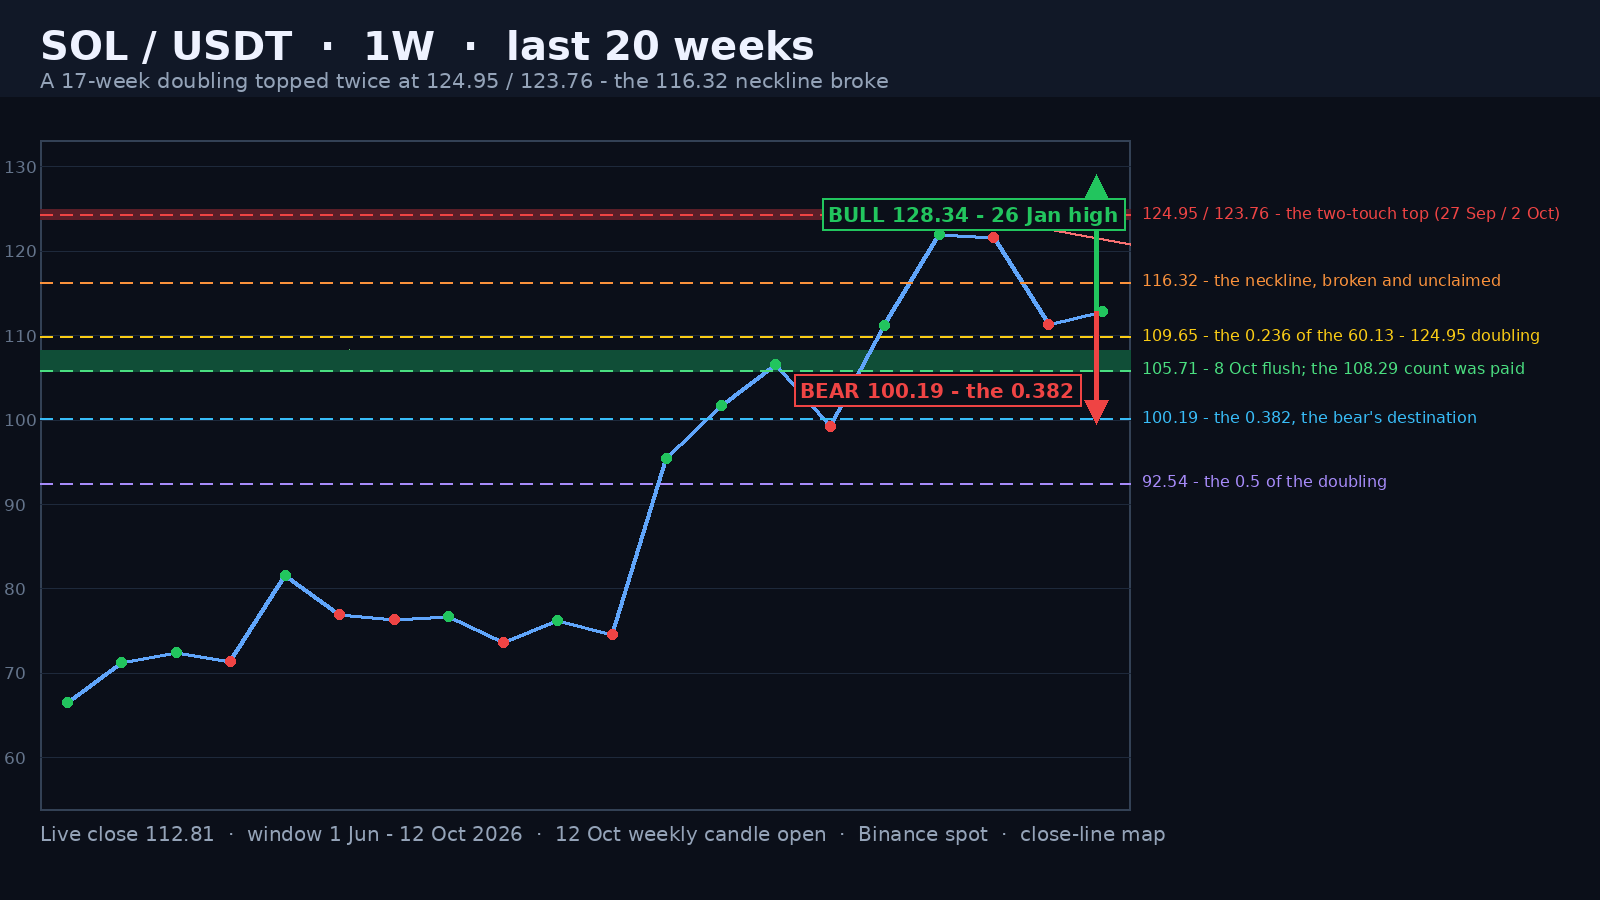
SOL closed the week of 5 October at 111.35 and is trading 112.90 early in the 12 October week — 61.9% under the 295.83 high of 13 January 2025, 87.6% above the 60.13 cycle low of 1 June 2026, and 9.7% under the 124.95 top of 27 September. The last twenty weekly candles hold the whole story: a 107.8% doubling, a two-touch top, and a neckline that broke in eight days.
A 17-Week Doubling Into 124.95
From the 60.13 low of the 1 June week to the 124.95 high of 27 September, SOL ran 107.8% in seventeen weeks. The last leg was almost mechanical: +27.9% in the week of 17 August, with a 74.62 open, a 102.74 high and a 95.43 close on 1.21x volume; then +6.6%, +4.7%, one 6.8% give-back week to 99.30, then +12.0% to 111.17 and +9.7% to 121.99. The 95.82 low of the 14 September week was the last higher low, and it has never been revisited.
Advertisement
The Second Touch Came on Half the Volume
The 28 September week printed 123.76 — 0.96% under the first peak — and closed at 121.60, only 0.3% down. That is a textbook second touch, and it came on 0.69x volume. The next week did the damage: SOL lost the 116.32 neckline on 7 October, flushed to 105.71 on 8 October, and closed the week 8.4% lower at 111.35.
The Count Was Paid — and the 0.236 Held
The two-touch top measures 8.035 points from the 124.355 average of the peaks to the 116.32 neckline, which projects 108.29. The 8 October flush printed 105.71 — 102.4% of the count, so the target was not just reached, it was overshot by 2.4%. Then the weekly close at 111.35 reclaimed the 0.236 of the entire doubling, which sits at 109.65 on the 64.82-point leg from 60.13. The 0.382 is 100.19, the 0.5 is 92.54 and the 0.618 is 84.89. A 29.7% retrace that pays its measured move and still closes above the first Fibonacci rung is a correction — but the burden of proof has moved to the bulls.
Advertisement
The Bull Case: Reclaim 116.32, Then Re-Test 124.95
Everything starts with the 116.32 neckline. Until there is a weekly close above it, SOL is trading under broken support that has become resistance. Above it: 120.00, the 122.08 high of the 5 October week, 123.76 and 124.95. A weekly close above 124.95 opens the December to January shelf the 2026 downtrend left behind — 128.34 (the 26 January high), 135.54 (the 29 December 2025 high), 137.87 (the 19 January 2026 high) and 148.74 (the 12 January 2026 high). The three-month range from 105.71 to 124.95 is 19.24 points wide, and a breakout projects 144.19, 3.1% under that January high. The case is cancelled by a weekly close back under 110.69.
The Bear Case: 110.69 First, Then 100.19
The bull case has a thin floor beneath it. The low of the candle that printed the 124.95 top is 110.69, and SOL trades 1.9% above it. Under that line the sequence is 107.36 (the 31 August high), 105.71 (the 8 October flush), 102.74 (the 17 August breakout high) and 100.19, the 0.382 of the doubling. Below 100.19 the market starts talking about the 14 September higher low at 95.82 and the 0.5 at 92.54, with 84.89 the destination. This case is cancelled by a weekly close above 116.32 — which is also the bulls' first requirement, and that is the whole problem.
Where the Odds Sit
This is close to a coin flip: 50/50, with a slight edge to the bulls on volume rather than price. The 0.236 held on a weekly-close basis, and the two weeks that did the damage came on 0.91x and 0.55x volume — there was no climactic distribution, no 2x-plus capitulation candle. Against that, the neckline is broken and unclaimed, the last four weekly highs are 124.95, 123.76, 122.08 and 113.40, and the 110.69 low of the top candle is only 1.9% away. A first test of 105.71 is as likely as a reclaim of 116.32, and a week that closes between 110.69 and 116.32 changes nothing at all.
The levels, in order. Above: 113.40 is this week's high, then 114.32, 116.32 (the neckline), 120.00, 122.08, 123.76 and 124.95, with 128.34 the first rung of the January shelf. Below: 110.69 (the top candle's low), 107.36, 105.71, 102.74, 100.19 (the 0.382), 98.00, 95.82, 92.54 and 84.89 (the 0.618). SOL is 62% under its 2025 high and 88% above its June low — a 17-week doubling that paid its measured retracement and is now waiting for one weekly close to choose a half of the range.
Written by
EarnCrypto.dev Editorial
The EarnCrypto.dev editorial team researches and reviews AI mining platforms, pools and earning tools — publishing only what passes our own checks.
Related reading

AVAX Weekly Analysis — A 55.2% Thrust and Four 2x-Volume Weeks Under a 12.008 Two-Touch Top: The 10.866 Retrace Decides 14.25 or 8.387
AVAX ran a 55.2% week on 2.27x volume, then coiled four weeks under an 11.799 / 12.008 two-touch top. The 10.866 line decides 14.25 or the 8.387 count.

ETH Daily Analysis — A 2,392.96 Count 94% Filled and Five Rising Lows Back at the 0.382: The 2,635 Line Decides 2,777 or 2,406
ETH's 2,807/2,600 distribution left a 2,392.96 count that went 94% filled at 2,406.11. Five rising lows have retaken the 0.382 — 2,635 decides 2,777 or 2,406.
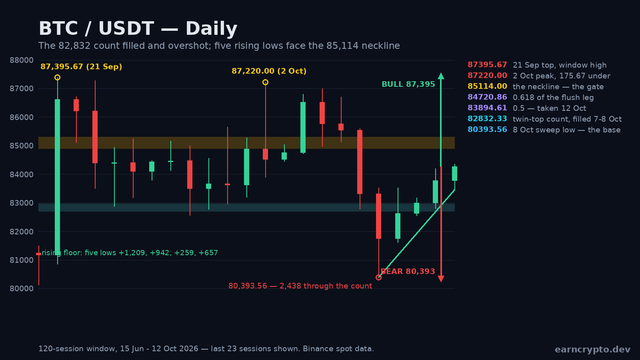
BTC Daily Analysis — Five Rising Lows After the 82,832 Count Filled and Overshot by 2,438: The 85,114 Neckline Decides 87,395 or 80,393
BTC's 87,395/87,220 twin top delivered its 82,832 count and overshot it by 2,438. Five rising lows have retaken the 0.5 — 85,114 decides 87,395 or 80,393.