
ADA Weekly Analysis — Ascending Base Under the $0.2321 Triple Ceiling: 0.2887 or 0.1894
Cardano has built five straight weekly higher lows under a three-touch $0.2321 ceiling. A weekly close above it opens $0.2887 — below $0.1894 the base fails.
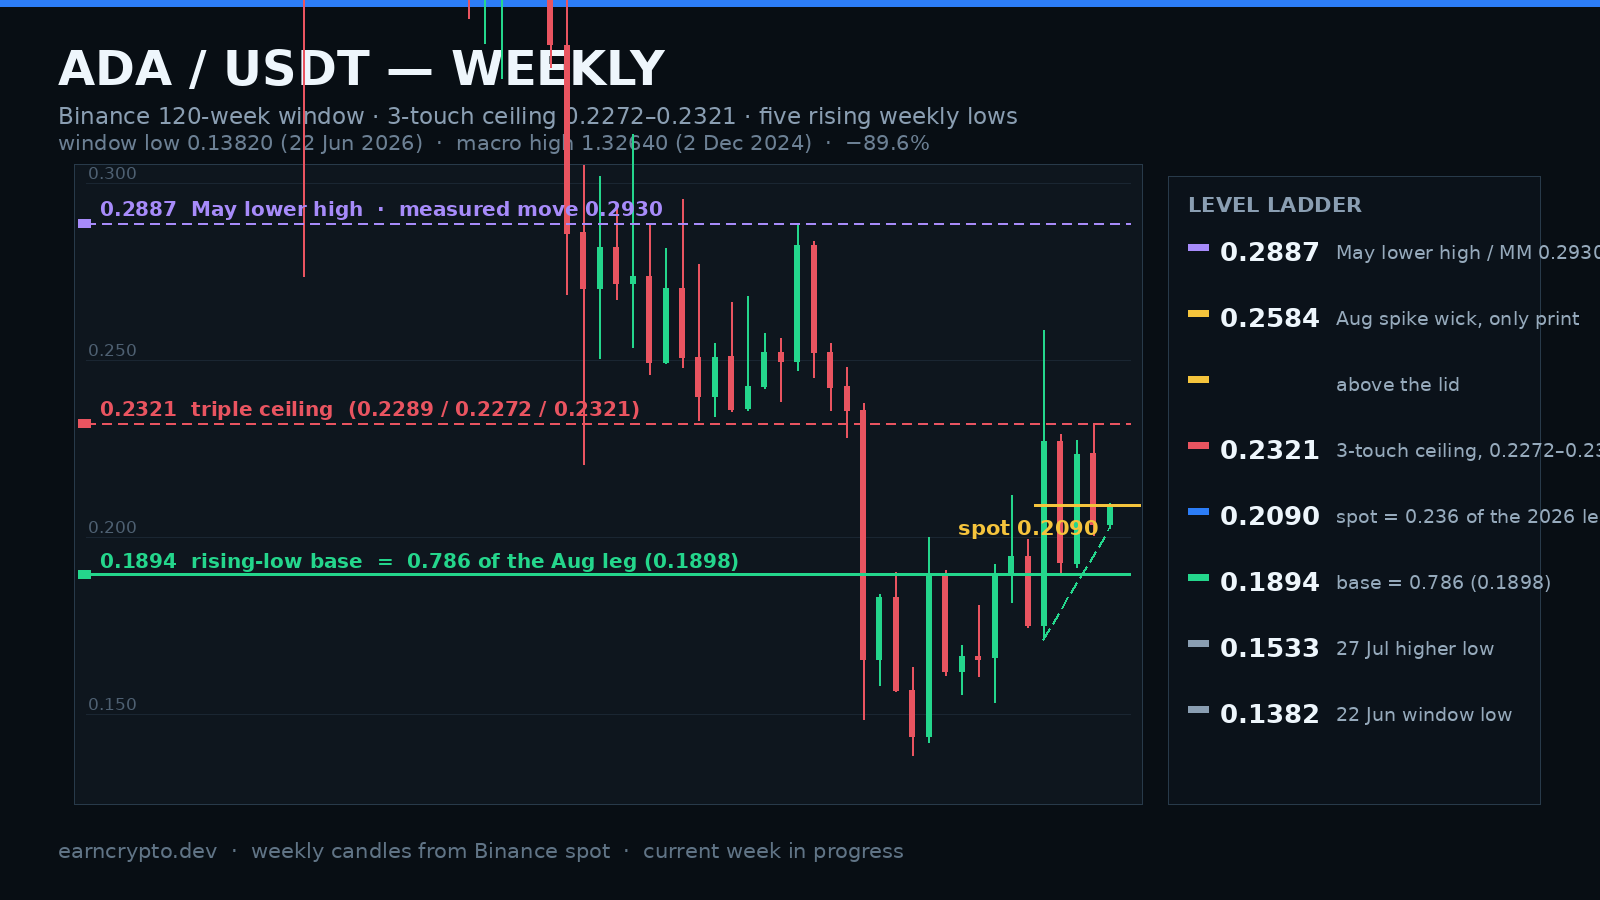
The 120-candle window opens on 2024-06-03 with Cardano at $0.4442 and ends with the current week at $0.2091. In between sits one of the most complete distribution cycles of the last two years: a peak of $1.3264 in the week of 2024-12-02, then eighteen months of lower highs — $1.1662 (2025-01-13), $1.1747 (2025-03-03), $1.0193 (2025-08-11), $0.4374 (2026-01-05), $0.3136 (2026-02-23), $0.2887 (2026-05-04) — and a final capitulation to $0.1382 in the week of 2026-06-22. That low is 89.6% below the high.
The pivot came immediately after. The week of 2026-06-29 opened at $0.1438, refused to make a new low ($0.1419), ran to $0.2000 and closed at $0.1895 — a 31.8% weekly gain on 1.449 billion ADA, the heaviest week since the 2026-06-01 crash (2.131 billion). Ten weeks later that reversal is still intact, and the weekly structure has quietly turned into compression rather than distribution.
Advertisement
The $0.2321 ceiling has rejected three weeks in a row
Since the August spike, the last three completed weeks printed highs of $0.2289 (2026-08-24), $0.2272 (2026-08-31) and $0.2321 (2026-09-07). Three consecutive weekly highs inside a band 4.9 ticks wide — 2.1% of spot — is a ceiling, not a coincidence. The only print above it in ten weeks was the $0.2584 wick on the week of 2026-08-17, and that week closed $0.0314 below its own high: sellers used the wick, they did not hold the level.
That gives the ceiling a clear job. Every hourly and daily push into $0.2272–$0.2321 this month has been sold, and the last rejection (2026-09-07 week) closed $0.2035 — $0.0286 below the high. What has not happened is a weekly close above it. Until that print exists, the range logic stands.
Advertisement
Five higher lows, and the 0.786 that anchors them
The other half of the picture is the base. Weekly lows since the August impulse read $0.1712, $0.1894, $0.1915, $0.2004 and $0.2023 — five consecutive weeks of higher lows, each one lifting the floor under the ceiling. That sequence is the entire bull thesis. It is also measurable: the August leg ran from $0.1712 to $0.2584 (range $0.0872), and its 0.786 retracement sits at $0.1898. The weekly low that started the staircase printed $0.1894 — four ticks away. Two independent methods, one level.
Overhead, the picture has a second reference. The 2026 decline from $0.4374 to $0.1382 retraces 0.236 at $0.2088 — within $0.0002 of the current $0.2091 — 0.382 at $0.2525 and 0.500 at $0.2878. So the ceiling band coincides with the 0.382-to-0.236 zone of the August leg ($0.2251–$0.2378) and the first real target coincides with the 0.500 of the yearly leg. The levels are lining up instead of fighting each other, which is what a genuine base looks like.
Bull case: $0.2887–$0.2930 is where the measured move lands
The flat top is $0.2321 and the base of the structure is $0.1712, a height of $0.0609. Projected from the ceiling, the measured move lands at $0.2930. That number is not chosen: the May 2026 lower high sits at $0.2887 and the 0.500 retracement of the yearly leg at $0.2878, so the $0.2878–$0.2930 zone carries three separate reasons to expect supply. A weekly close above $0.2321 turns three weeks of rejection into support and opens that zone. Above it, the next objective is the 0.618 at $0.3231 — the same $0.3260 a projection from the June low $0.1382 produces.
Realistically, that is a two-to-four month stair-step, not a straight line. The weekly ATR(14) is $0.0360, or 17.2% of spot: an ordinary week can trade a $0.0360 range without breaking anything. The path that fits: a push into $0.2265–$0.2321, a rejection wick (the third one), a pullback to rebuild above $0.2150, and only then a weekly close above the ceiling. The nearest volume-weighted shelf above the ceiling is thin until $0.2584, which is why a confirmed break can travel quickly.
Bear case and what invalidates each side
The bear argument is simpler and it has already worked three times: the ceiling holds, the $0.2584 wick proves supply is stacked above, and each failed push bleeds momentum. A drop back through $0.2004 turns the fifth higher low into a lower high, and the next stop is the $0.1894–$0.1898 confluence — the 0.786 of the August leg and the anchor of the whole staircase. Below it, $0.1746 and $0.1712 are the last defence before the June low at $0.1382 becomes the magnet.
So the two numbers that matter are the ceiling at $0.2321 and the base at $0.1894. A weekly close above the first is a breakout with a measured move to $0.2887–$0.2930 and invalidation at $0.1894. A weekly close below the second cancels the ascending structure, turns the 0.500 retracement into resistance at $0.2878 on any bounce, and puts the $0.1533 July higher low back on the map. Between them the path of least resistance still tilts up — the base has more touches behind it than the ceiling does, and the up weeks carry the volume (1.482B, 1.028B and 1.076B against 0.846B, 0.428B and 0.558B on the down weeks).
A three-touch ceiling with five rising lows underneath is pressure, not indecision. The weekly close above $0.2321 is the only signal that matters — everything before it is noise.
The chart above is frozen on real Binance weekly candles and replays in order: the three-touch ceiling, the rising-low rail and the measured-move target. Weekly structure like this is published on EarnCrypto every week, alongside the level ladders and scenario paths used here.
Written by
EarnCrypto.dev Editorial
The EarnCrypto.dev editorial team researches and reviews AI mining platforms, pools and earning tools — publishing only what passes our own checks.
Related reading

SOL Daily Analysis — Three Touches Under the $120.00 Round Number: The 114.29 Retrace Decides 126.56 or 105.05
Solana has been rejected at the $120.00 round number three sessions in a row after a 25% week. The $114.29 retrace decides whether 126.56 or 105.05 comes next.

BTC Daily Analysis — The 82,300 Box Broke: The 87,396 Double Touch Decides 90,776 or 82,648
Bitcoin broke its five-week $82,300 box on 21 September and has coiled under $87,396 since. The $84,463 retrace decides whether 90,776 or 82,648 comes next.

BNB Daily Analysis — The $780.64 Ceiling Broke: The 782.98 Retrace Decides 858 or 741
BNB cleared the $780.64 ceiling that had held since September 5 and reversed to 782.75 today, two ticks off the 782.98 retracement. The measured move is 858.