
SOL Daily Analysis — Three Touches Under the $120.00 Round Number: The 114.29 Retrace Decides 126.56 or 105.05
Solana has been rejected at the $120.00 round number three sessions in a row after a 25% week. The $114.29 retrace decides whether 126.56 or 105.05 comes next.
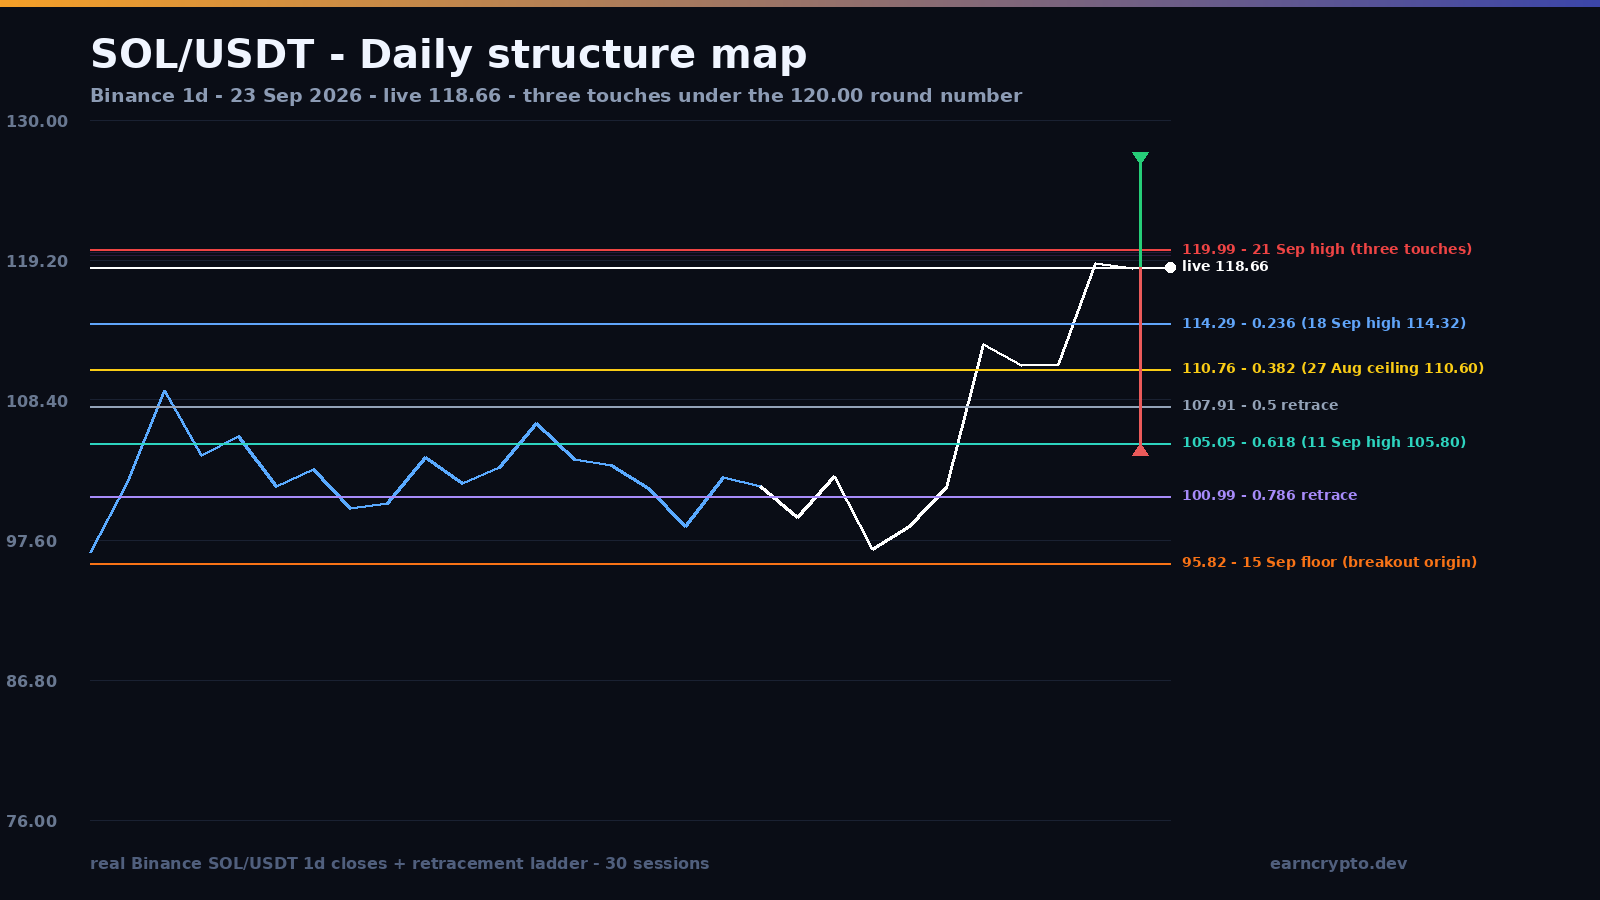
Solana has been rejected at the same round number in three straight sessions. The 21 September candle ran from 110.69 to 119.99 and closed at 118.90 on 4,612,620 SOL (1.85 times the twenty-day average), the 22nd printed a high of 119.48, and today's high of 119.77 sits 0.22 under the ceiling. Three touches inside a 0.51-dollar band at 119.99, and the highest prints since 29 January.
Twenty-Five Percent in Five Sessions
The move that created this ceiling started at the 15 September low of 95.82 and ended at 119.99 - 25.2% in five sessions. Off the 6 June low at 60.13, SOL is 97.4% higher, a hair under a double, having spent the summer rebuilding from the deepest part of its range.
Advertisement
The breakout session was 18 September: a 101.63 open, a 114.32 high, a 112.72 close and 4,710,994 SOL traded, 1.89 times the twenty-day average of 2,487,147 and the heaviest print since 27 August. That candle cleared the 27 August ceiling at 110.60 in one move, and the 20 September session then undercut it to 107.40 before closing 111.17 - the retest that turned the old ceiling into a floor.
The $120.00 Round Number, Three Times
What has followed is compression, not distribution. The three highs - 119.99, 119.48 and 119.77 - sit 0.51 apart; the three lows - 110.69, 115.54 and 117.85 - are climbing. Today is trading 1.62% of range against a twenty-day average of 4.50%, on a 0.30 pace against the twenty-day average volume, which is a market resting under a level rather than one being sold.
Advertisement
The Ladder Under the Coil
The retracement ladder of the 95.82 floor to the 119.99 ceiling is unusually well-populated. The 0.236 is 114.29 and the 18 September high printed 114.32 - three hundredths apart. The 0.382 is 110.76 and the 27 August ceiling sits at 110.60, 0.16 below it. The 0.5 is 107.91, and the 0.618 is 105.05 against the 11 September high of 105.80.
The wider leg from the June low adds a second layer: its 0.236 is 105.86, almost exactly the 11 September high, and its 0.382 is 97.12, which sits between the 2 September low at 97.38 and the 15 September floor at 95.82. Levels that show up on two different measurements are the ones worth trading.
Three touches at one round number is not a coincidence, it is supply. Whoever wanted out at 119.99 is nearly done - the question is whether the bids that carried this from 95.82 are still there after a 25% week.
What the Bulls Need
A daily close above 119.99 opens the range measured move - the 14.78 points between the 95.82 floor and the 110.60 ceiling - which projects 125.38, and the 1.272 extension of the September leg lands at 126.56, stacking two independent measurements into the same three-dollar zone. Beyond that the 1.618 extension sits at 134.93. The invalidation is a daily close below 114.29: that is where the 18 September high waits, and losing it means the coil is being distributed rather than reloaded. On this structure the path of least resistance still leans upward, roughly sixty-forty, because every dip for five sessions has been bought.
What the Bears Need
The bear case starts with the 0.382. A close under 114.29 makes the 27 August ceiling at 110.60 the market's problem again - a level that was resistance for three weeks and support for three sessions. Lose it and the ladder runs 107.91 (0.5), then 105.05 (0.618, reinforced by the 105.86 rung of the June leg), then 100.99 (0.786). Below the 95.82 floor the September breakout is a failed move and the 0.5 of the whole 60.13 to 119.99 advance at 90.06 becomes the next reference.
Momentum is stretched in the short term and that cuts both ways: RSI(14) is 69.3 after a 20.3% week, price is 12.3% above the twenty-day average of 105.67 and 24.9% above the fifty-day at 95.01, and ATR(14) is 5.14 - about 4.3% of spot, so a 0.382 retrace is a two-session event, not a month-long slide. For scale, SOL is still well under its 18 September 2025 high at 253.51.
Watch two lines: 119.99 above, 114.29 below. Live levels on Binance SOL/USDT, market data on CoinGecko, and the chart on TradingView.
Written by
EarnCrypto.dev Editorial
The EarnCrypto.dev editorial team researches and reviews AI mining platforms, pools and earning tools — publishing only what passes our own checks.
Related reading

BTC Daily Analysis — The 82,300 Box Broke: The 87,396 Double Touch Decides 90,776 or 82,648
Bitcoin broke its five-week $82,300 box on 21 September and has coiled under $87,396 since. The $84,463 retrace decides whether 90,776 or 82,648 comes next.

BNB Daily Analysis — The $780.64 Ceiling Broke: The 782.98 Retrace Decides 858 or 741
BNB cleared the $780.64 ceiling that had held since September 5 and reversed to 782.75 today, two ticks off the 782.98 retracement. The measured move is 858.
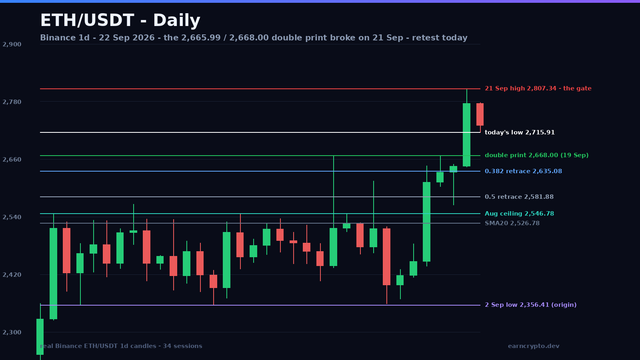
ETH Daily Analysis — Double Top Absorbed at $2,668.00: The Break Decides 2,976 or 2,582
Ether broke the $2,665.99 and $2,668.00 double print on September 21 on 1.79x volume and is retesting it today, holding 2,715.91. The measured move is 2,976.