
ETH Daily Analysis — Double Top Absorbed at $2,668.00: The Break Decides 2,976 or 2,582
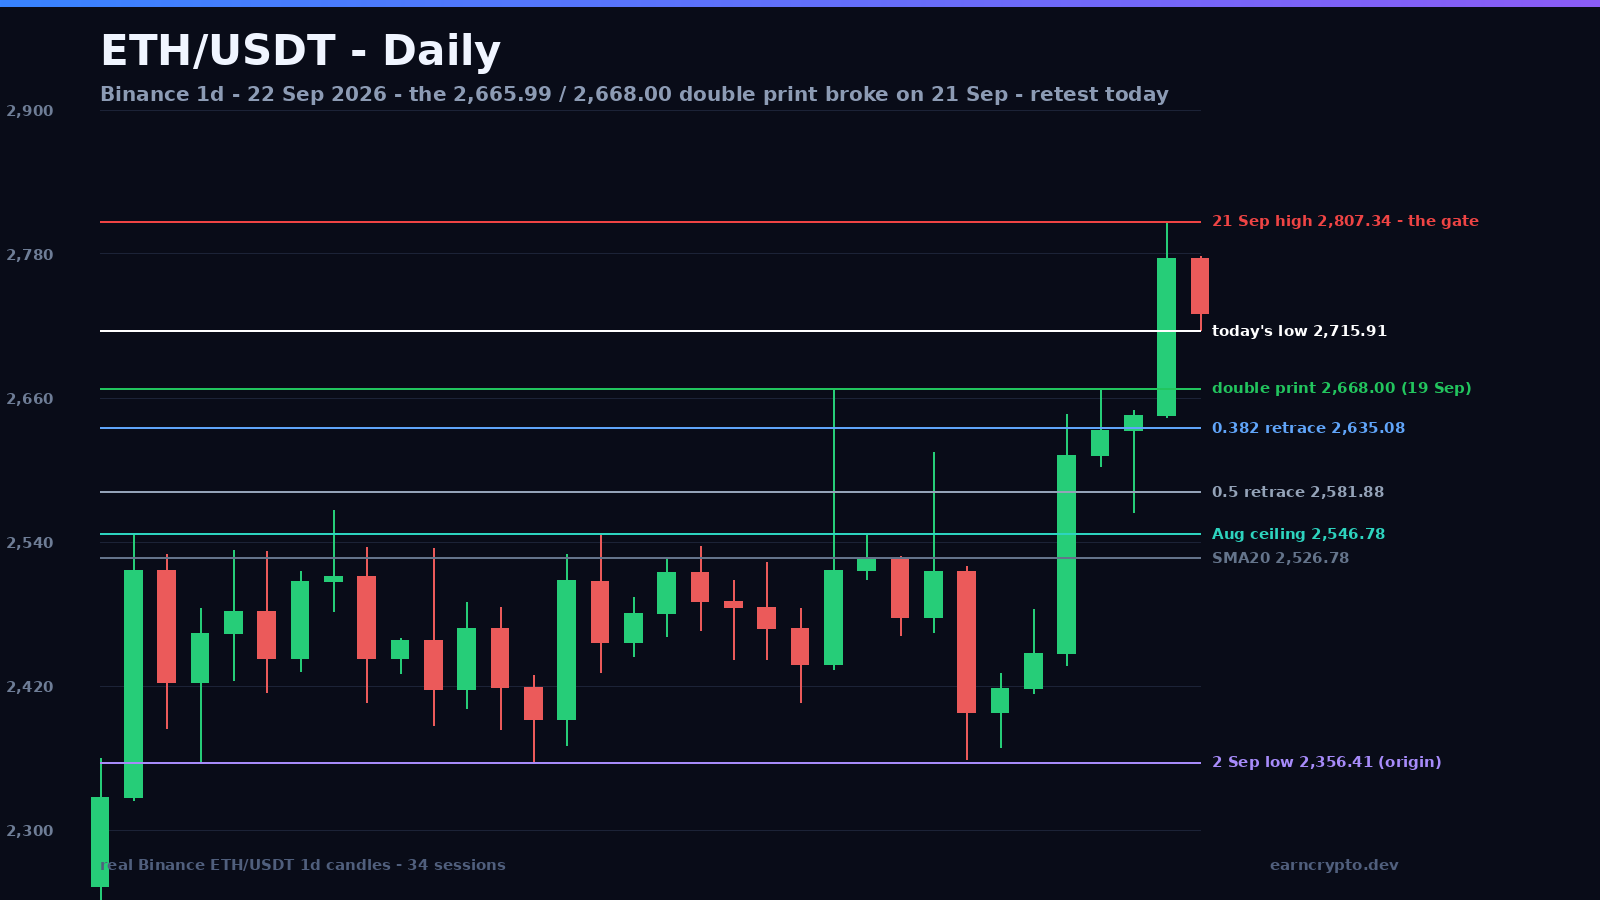
Ether broke the $2,665.99 and $2,668.00 double print on September 21 on 1.79x volume and is retesting it today, holding 2,715.91. The measured move is 2,976.
The same price twice, twelve ticks apart
Three weeks of Ether topped out at the same price twice. The first print was 2,665.99 on 11 September — a spike that closed 5.6% below its own high on 639,602 ETH, the heaviest session of the month at the time. The second was 2,668.00 on 19 September, on a quieter 181,455 ETH. Twelve ticks apart, and between them the market put in a trough at 2,358.88 on 15 September. Under both sits the 2 September low at 2,356.41 — two ticks from that trough, and the floor of the entire structure.
Classically that is a double top: two highs, one trough, a measured destination below. The market did the opposite. On 21 September Ether opened at 2,645.21, ran to 2,807.34 and closed at 2,776.19 — 4.1% above the higher of the two peaks — on 573,090 ETH. Against the twenty-day average of 320,196 that is 1.79x, the heaviest session since 19 August, when the original breakout printed 2.50x. The close was Ether's highest since 29 January 2026.
Advertisement
A pattern that fails upward is information, not noise. Three weeks of supply at 2,666-2,668 was absorbed in one session, and the sellers who defined that top are now the demand that has to defend it. Today is the first trip back: the session opened 2,776.20, printed 2,777.55 and 2,715.91, and is trading 2,733.60 — 2.5% above the double print and 2.6% below Monday’s high, in a range of 2.25% against a twenty-day average of 4.05%.
Fourteen highs inside a twenty-seven point band
The range that broke is tighter than the two peaks suggest. Between 21 August and 15 September the ceiling printed 14 separate daily highs inside a 26.78-point band — 2,546.78, 2,529.99, 2,532.95, 2,532.50, 2,535.05, 2,534.98, 2,529.84, 2,546.66, 2,526.20, 2,536.64, 2,523.30, 2,546.01, 2,527.56, 2,520.00 — while the floor was built twice at 2,356.41 and 2,358.88, two ticks apart. That is a rectangle, not a trend: a floor that held twice and a ceiling that held 14 times, with the 2,566.53 high of 27 August as the one print that poked above it.
Advertisement
Height of the rectangle, measured from the 15 September trough to the higher peak, is 309.12 points; measured from the 2 September floor it is 311.59. Projected above the 2,668.00 break those give 2,977.12 and 2,979.59 — a band rather than a line, and the same 2,976 this page published on 19 September, when the neckline was still resistance rather than support.
The retracement ladder under the retest
If the breakout is real, the first test is the 0.236 retracement of the September leg. Drawn from 2,356.41 to 2,807.34 (450.93 points), the rungs are 2,700.92 (0.236), 2,635.08 (0.382), 2,581.88 (0.5), 2,528.67 (0.618) and 2,452.91 (0.786). Today’s low at 2,715.91 stopped 0.55% above the first of them, which is exactly where a healthy retest should stop.
Below that, the rungs stop being arithmetic and start agreeing with structure. The 0.382 at 2,635.08 sits inside the base of the breakout candle itself: the 18 September high at 2,646.00, the 19 September close at 2,632.69 and Monday’s low at 2,643.71 all live within eleven points of it. The 0.5 at 2,581.88 is 17.55 points above the 20 September low at 2,564.33, and the 0.618 at 2,528.67 is 1.74 points from the twenty-day average at 2,526.93. Two of the four rungs land on levels this market already defended once.
What has to hold, and what cancels it
The bull case needs 2,668.00 to keep acting as a floor rather than a memory. Above today’s low at 2,715.91 the levels are 2,777.55, then 2,807.34 — and above that the chart is empty until 2,828.65, the 30 January 2026 high, because Monday’s print is the highest Ether has traded since then. The invalidation is a daily close below 2,635.08: that would put the 0.382 and the base of the breakout candle behind the market and hand 2,581.88 and the twenty-day average at 2,526.93 back to the sellers. An early warning is a close back under 2,700.92.
The bear case dies on a daily close above 2,807.34. It is worth saying plainly how far the destination is: 2,977-2,980 is about 8.9% above spot, and the first wall on the way is the late-January shelf at 3,013.50-3,045.78, where Ether was closing 2,822.59 on 29 January 2026, before the decline that reached 1,505.68 in June. The band sits 1.1% under the bottom of that shelf, which is why a first attempt at it usually stalls rather than runs.
The two paths
Path of least resistance stays upward while 2,668.00 holds — and it is not a straight line. Expect a first rejection at 2,807.34 that pulls back into the 2,778-2,807 area, then a close above the 21 September high, then 2,828.65 and the 1.272 extension at 2,929.99, and only then the measured band at 2,977-2,980. Monday’s candle is the template: it opened at 2,645.21 — 0.79 under the 18 September high — and closed 4.95% higher, so the 2,715.91 print will matter more this week than the 2,777.55 one.
The bear path starts with a failed retest: a close under 2,700.92, a sweep of 2,668.00 that finds no bid, then the ladder in reverse — 2,635.08, 2,581.88 and the 2,528.67 / 2,526.93 confluence. Losing that confluence would mean the 21 September candle was a liquidity event rather than a re-rating, and the 2,405.85-2,356.41 floor, where this range was built, comes back into play. Probabilities: roughly 60/40 to the upside while the retest holds, and the ratio flips the moment a daily candle closes under 2,635.08.
The 19 September note here, the double-bottom reversal at the 2,666 neckline, arrived at the same 2,976 from the other side, and the 4 September map of the 2,666 double top drew this level when it was still resistance. Live prices are on Binance and CoinGecko.
Two peaks twelve ticks apart, a trough 309 points below them, and one 1.79x candle through the whole thing. The pattern resolved upward, and 2,668.00 — not 2,807.34 — is the level that decides whether that resolution was real.
Written by
EarnCrypto.dev Editorial
The EarnCrypto.dev editorial team researches and reviews AI mining platforms, pools and earning tools — publishing only what passes our own checks.
Related reading

SOL Daily Analysis — Three Touches Under the $120.00 Round Number: The 114.29 Retrace Decides 126.56 or 105.05
Solana has been rejected at the $120.00 round number three sessions in a row after a 25% week. The $114.29 retrace decides whether 126.56 or 105.05 comes next.

BTC Daily Analysis — The 82,300 Box Broke: The 87,396 Double Touch Decides 90,776 or 82,648
Bitcoin broke its five-week $82,300 box on 21 September and has coiled under $87,396 since. The $84,463 retrace decides whether 90,776 or 82,648 comes next.

BNB Daily Analysis — The $780.64 Ceiling Broke: The 782.98 Retrace Decides 858 or 741
BNB cleared the $780.64 ceiling that had held since September 5 and reversed to 782.75 today, two ticks off the 782.98 retracement. The measured move is 858.