
ETH Daily Analysis — Double Bottom Reversal: The $2,666 Neckline Decides 2,976 or 2,356
Ethereum closed at a seven-month high above the 2,546 shelf after a 2,356/2,359 double bottom — the 2,666 neckline decides a 2,976 measured move or 2,356.
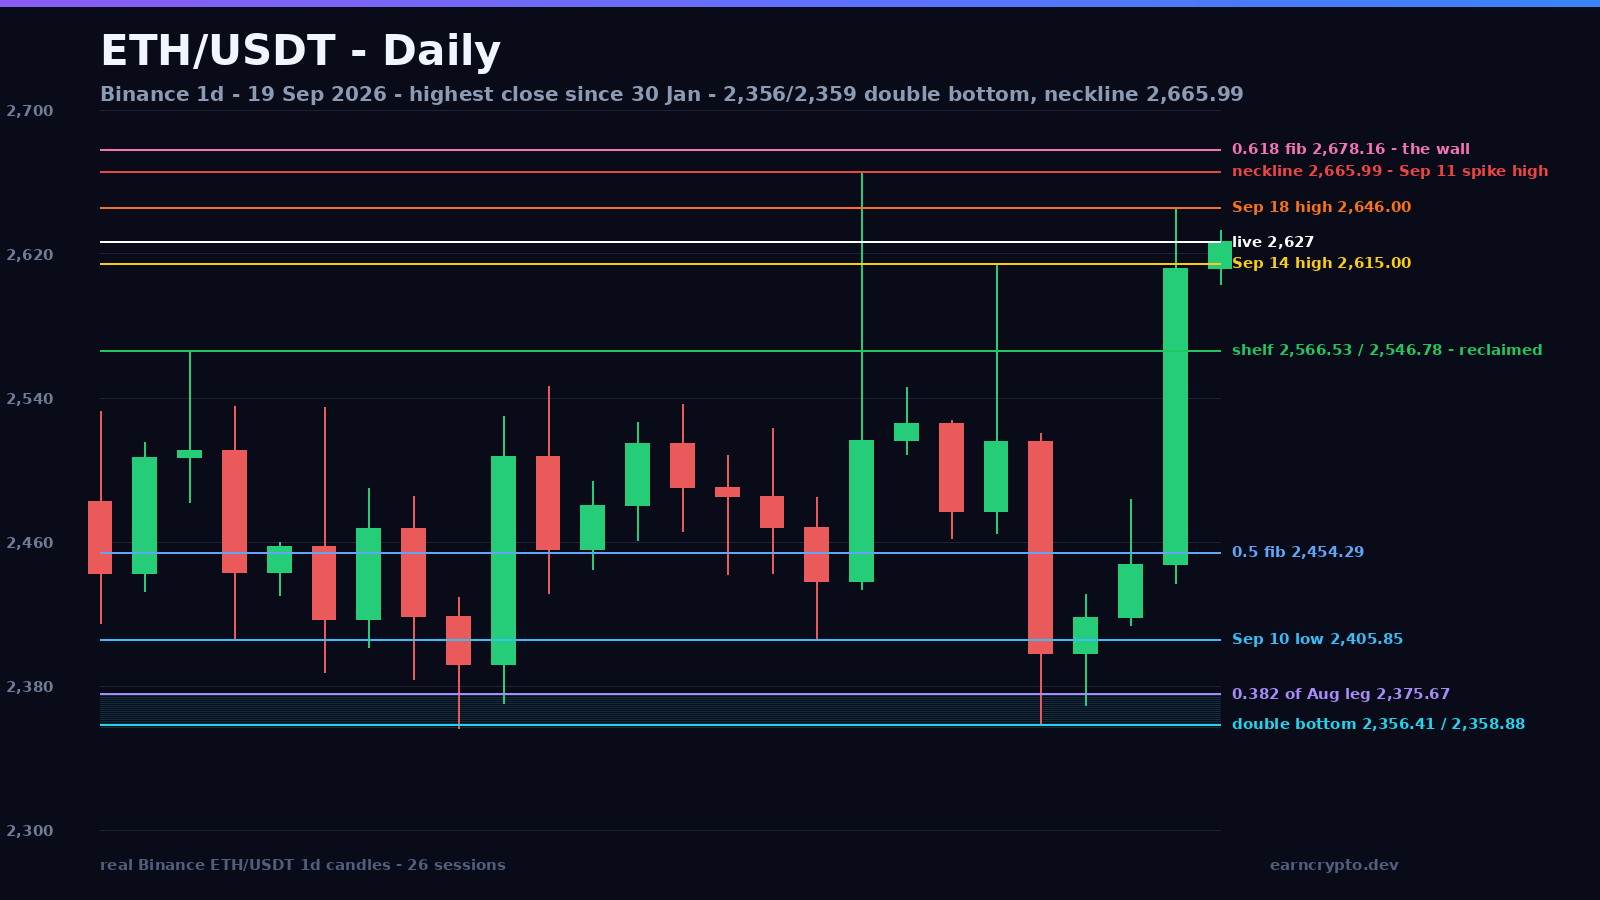
One candle erased three weeks of distribution
Ethereum topped the August rally twice: 2,546.78 on August 21 and 2,566.53 on August 27, both printed on volume more than twice the twenty-day average. For the three weeks that followed, every rally into that 2,546–2,567 shelf was sold — 2,529.84 on September 3, 2,546.66 on September 4, and then a spike to 2,665.99 on September 11 on 639,602 ETH, 2.05x the twenty-day average, which closed 149.56 points below its own high. Underneath all of it the floor kept printing in the same place: 2,356.41 on September 2 and 2,358.88 on September 15, 2.47 points apart.
Friday changed the shape of it. ETH opened 2,447.28, dipped to 2,436.89, ran to 2,646.00 and closed 2,612.14 — +6.73% on 507,313 ETH, 1.63x the twenty-day average, and the highest daily close since January 30. It was also the first close above the 2,546.78/2,566.53 shelf since August 27. Today's session has traded 2602.94 to 2633.33, with 54,180 ETH traded so far against a twenty-day average of 311,904.
Advertisement
Two lows inside $2.47, thirteen sessions apart
The double bottom is 2,356.41 (September 2) and 2,358.88 (September 15) — a 2.47-point floor tested thirteen sessions apart — and the neckline is the September 11 spike high at 2,665.99. The measured move is the depth of that pattern added to the neckline: 2,665.99 + 309.58 = 2,975.57.
That target does not stand alone. The 0.786 retracement of the January–June decline (3,402.89 to 1,505.68) sits at 2,996.89 — 21 points above the measured move. Two independent counts, one band between 2,976 and 2,997. The floor has the same kind of backing: the 0.382 retracement of the August impulse (1,906.00 to 2,665.99) is 2,375.67, 17 to 19 points above the two lows, and the 0.5 retracement of the wider decline at 2,454.28 is exactly where Wednesday closed (2,447.28) before Friday cleared it.
Advertisement
The $2,666–2,678 wall
Everything now hinges on a 12-point band. The September 11 spike high at 2,665.99 is the top of the pattern, and the 0.618 retracement of the January–June decline sits at 2,678.16 — the two together form a wall the market has already refused twice, once with the September 11 wick and once with the lower high at 2,615.00 on September 14. Above that wall there is nothing to lean on for a long way: no candle high above 2,475.98 printed between February 1 and July 1, so the entire band from 2,666 up to the January 28 lower high at 3,045.78 was vacated in one month.
Volume is the honest caveat. Friday did 1.63x the twenty-day average, which is a real expansion but not a climax — the heaviest session of the 120-candle window is still June 5, when 1,257,013 ETH changed hands into the bottom. The buying that matters is the kind that shows up as a second consecutive close above the shelf, not as one big green candle.
The frame
RSI(14) closed the week at 64.4, up from 54.2 the day before — strong, not stretched. The 20-day average at 2,472.30 is 5.7% under Friday's close and the 50-day at 2,242.86 is 14.1% below it, so both are acting as support rather than resistance for the first time since the August explosion. ATR(14) is $104.94, 4.0% of spot: any stop that survives this market's ordinary noise has to be wider than one daily range. ETH is +3.4% over seven days and +12.3% over thirty.
Invalidation is specific. A daily close back under 2,546 — the shelf that was resistance for three weeks — puts the breakout on probation; a close under 2,454 (the 0.5 retracement) kills it outright and reopens 2,405.85, 2,369.11 and the 2,358.88/2,356.41 floor. While 2,546 holds on a closing basis the path of least resistance runs at the 2,666–2,678 wall first and then the 2,976–2,997 band; I would put that at roughly 60/40 rather than call it a certainty.
A double bottom is only as good as its neckline, and this one sits 1.5% above Friday's close inside a band the market has already rejected twice. I would rather see the third attempt close above 2,666 than buy the middle of the wall — the trade is the confirmation, not the anticipation.
The candles behind this analysis are Binance's ETH/USDT daily series; the same structure is on TradingView, and the live quote and market capitalisation are on CoinGecko.
Written by
EarnCrypto.dev Editorial
The EarnCrypto.dev editorial team researches and reviews AI mining platforms, pools and earning tools — publishing only what passes our own checks.
Related reading

SOL Daily Analysis — Three Touches Under the $120.00 Round Number: The 114.29 Retrace Decides 126.56 or 105.05
Solana has been rejected at the $120.00 round number three sessions in a row after a 25% week. The $114.29 retrace decides whether 126.56 or 105.05 comes next.

BTC Daily Analysis — The 82,300 Box Broke: The 87,396 Double Touch Decides 90,776 or 82,648
Bitcoin broke its five-week $82,300 box on 21 September and has coiled under $87,396 since. The $84,463 retrace decides whether 90,776 or 82,648 comes next.

BNB Daily Analysis — The $780.64 Ceiling Broke: The 782.98 Retrace Decides 858 or 741
BNB cleared the $780.64 ceiling that had held since September 5 and reversed to 782.75 today, two ticks off the 782.98 retracement. The measured move is 858.