
BTC Daily Analysis — The 82,300 Box Broke: The 87,396 Double Touch Decides 90,776 or 82,648
Bitcoin broke its five-week $82,300 box on 21 September and has coiled under $87,396 since. The $84,463 retrace decides whether 90,776 or 82,648 comes next.
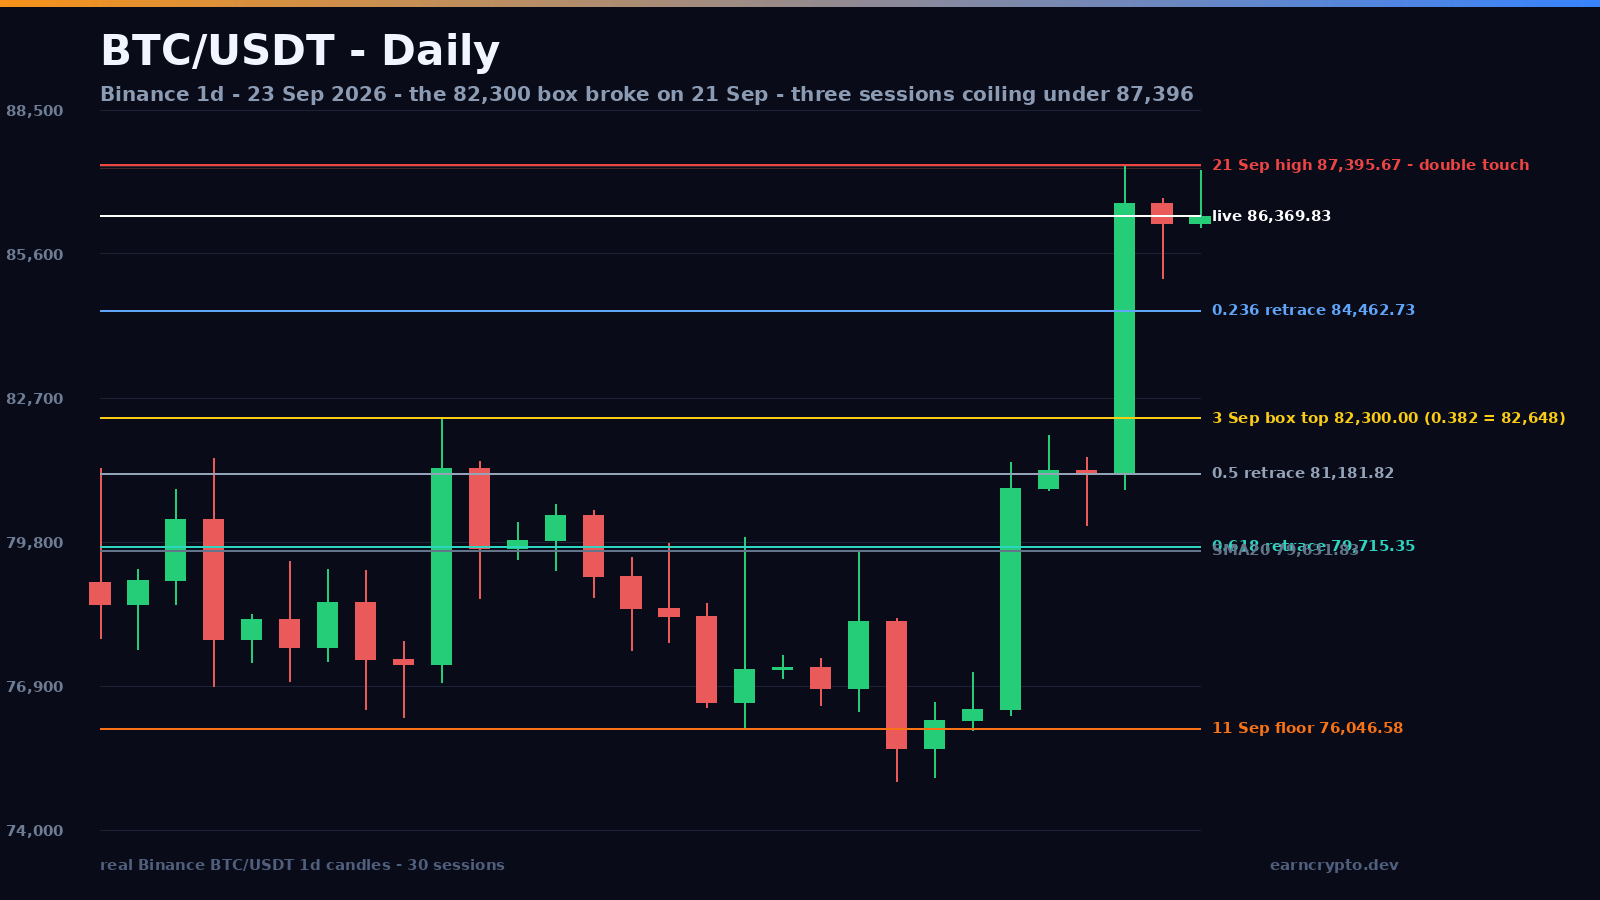
Bitcoin broke the ceiling that had capped it for five weeks, and it has spent the three sessions since deciding what to do with the win. The 21 September candle opened at 81,178.01 and ran to 87,395.67, the highest price since 29 January, closing at 86,620.00 on 31,963 BTC. That is 2.04 times the twenty-day average of 15,637 and the heaviest session since 21 August, and price has not given any of it back: the 22 September close sits at 86,208.56 and the market is trading 86,350.87 today.
The Five-Week Box Is Gone
Eighteen sessions between 3 and 20 September traded inside a 6,253-point band, with the lid at 82,300.00 and the floor at 76,046.58. Three consecutive sessions - 15, 16 and 17 September - dipped under that floor to 74,967.97, 75,064.82 and 76,000.00, and only the first closed below it, at 75,644.48; the other two recovered into the range. The 15 September wick is the low of the entire advance.
Advertisement
What matters is the shape of the break. The 18 September session closed at 80,883.87 with a 81,400.00 high on 23,908 BTC (1.53x), and the 21 September candle carried straight through the 82,300.00 lid to 87,395.67 in one move. Seven sessions between 25 August and 20 September printed highs at or above 81,000.00 without a single close through the lid; that entire shelf became support in one candle, and the measured move of the 6,253-point range projects 88,553.42, which sits between the ceiling and the 1.272 extension.
Three Sessions, One Ceiling
The last three sessions tell a simpler story than the rally that produced them. The 21 September high was 87,395.67; the 22nd printed 86,717.60 and closed at 86,208.56; today's high is 87,278.54, 117 points under the ceiling. Three tests of the same rail from below, with the floor of the coil building on rising lows - the 21 September low at 80,850.22, the 22 September low at 85,114.00.
Advertisement
Range is contracting into it. The 21 September session spanned 7.56%, the 22nd 1.86%, and today just 1.33% against a twenty-day average of 2.74%. The last three sessions are a 0.31 pace against the twenty-day average volume, so the coil is thin on participation - which is what a resting market looks like at the top of a breakout, and also what makes it easy to resolve in either direction.
The Ladder Under the Breakout
The retracement ladder of the 74,967.97 floor to the 87,395.67 ceiling is where the decisions live. The 0.236 sits at 84,462.73 and the 22 September low at 85,114.00 held 651.27 points above it. The 0.382 lands at 82,648.29 - 348 points above the broken box top at 82,300.00, which is the confluence that turns a routine pullback into a thesis. Below that, the 0.5 is 81,181.82 and the 0.618 is 79,715.35.
Above the market, the same ladder runs the other way. The 1.272 extension of the leg sits at 90,776.00 and the 1.618 at 95,075.99, while the pole of the move - 76,296.00 on 18 September to 87,395.67 - measures 11,100 points and projects a continuation at 98,495.34 if this ever stops being a three-session coil.
Bitcoin is doing the boring part now: holding above the level that capped it for five weeks. That hold, not the candle that made it, is what tells us whether the 90,776.00 extension is on the table.
What the Bulls Need
A daily close above 87,395.67 opens the box measured move at 88,553.42 first, then the 1.272 extension at 90,776.00 and the 1.618 at 95,075.99. That is a 6.6% move from 86,350.87 - large for three sessions, ordinary for a fortnight, and consistent with an asset that has already travelled 15% from the 15 September low. The invalidation is clean: a daily close under 84,462.73, the 0.236, would say the breakout is being retested from above instead of extended, and the odds of the 95,075.99 path drop from roughly sixty to forty.
What the Bears Need
The bear case does not need a crash, it needs a failed retest. A daily close below 84,462.73 puts 82,648.29 in play, and 82,648.29 sits 348 points above the old 82,300.00 lid - that confluence is what makes it the first real decision level under the market. Lose it and the 0.5 at 81,181.82 and the 0.618 at 79,715.35 become the rungs the market slides on. A close under 76,296.00 would retrace the entire pole, taking the structure back to where the 18 September breakout began, and that is the honest downside measured move: 11,100 points from the ceiling.
The context is warm, not cold. RSI(14) is 71.9, price sits 8.4% above its twenty-day average of 79,628.59 and 15.8% above the fifty-day at 74,597.53, and ATR(14) is 2,384.63, about 2.8% of spot - so the daily bars move fast enough to reach any of these levels in a week. The 400-day window still shows the 6 October 2025 high at 126,199.63 overhead and the 1 July low at 57,800.19 below; Bitcoin is 49% above that low and still a third under its record.
What to watch from here is narrow: whether 87,395.67 closes, or whether 84,462.73 breaks. Everything between those two lines is noise. Live levels on Binance BTC/USDT, market data on CoinGecko, and the chart on TradingView.
Written by
EarnCrypto.dev Editorial
The EarnCrypto.dev editorial team researches and reviews AI mining platforms, pools and earning tools — publishing only what passes our own checks.
Related reading

SOL Daily Analysis — Three Touches Under the $120.00 Round Number: The 114.29 Retrace Decides 126.56 or 105.05
Solana has been rejected at the $120.00 round number three sessions in a row after a 25% week. The $114.29 retrace decides whether 126.56 or 105.05 comes next.

BNB Daily Analysis — The $780.64 Ceiling Broke: The 782.98 Retrace Decides 858 or 741
BNB cleared the $780.64 ceiling that had held since September 5 and reversed to 782.75 today, two ticks off the 782.98 retracement. The measured move is 858.
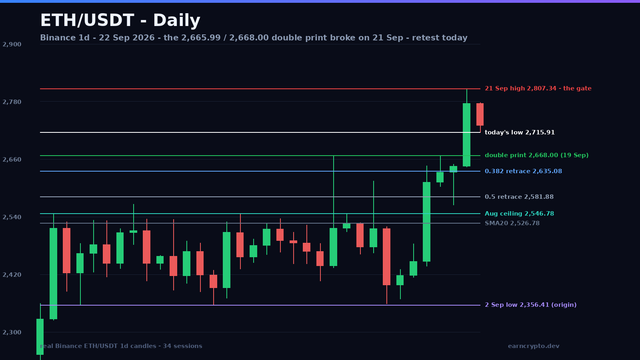
ETH Daily Analysis — Double Top Absorbed at $2,668.00: The Break Decides 2,976 or 2,582
Ether broke the $2,665.99 and $2,668.00 double print on September 21 on 1.79x volume and is retesting it today, holding 2,715.91. The measured move is 2,976.