
ETH Daily Analysis — Double Top at $2,666: The $2,462 Neckline Decides 2,245 or 2,812
Ethereum daily TA: the $2,665.99 spike closed $149.56 under its high and the retest died at $2,615 — the $2,462 neckline now decides 2,245 or 2,812.
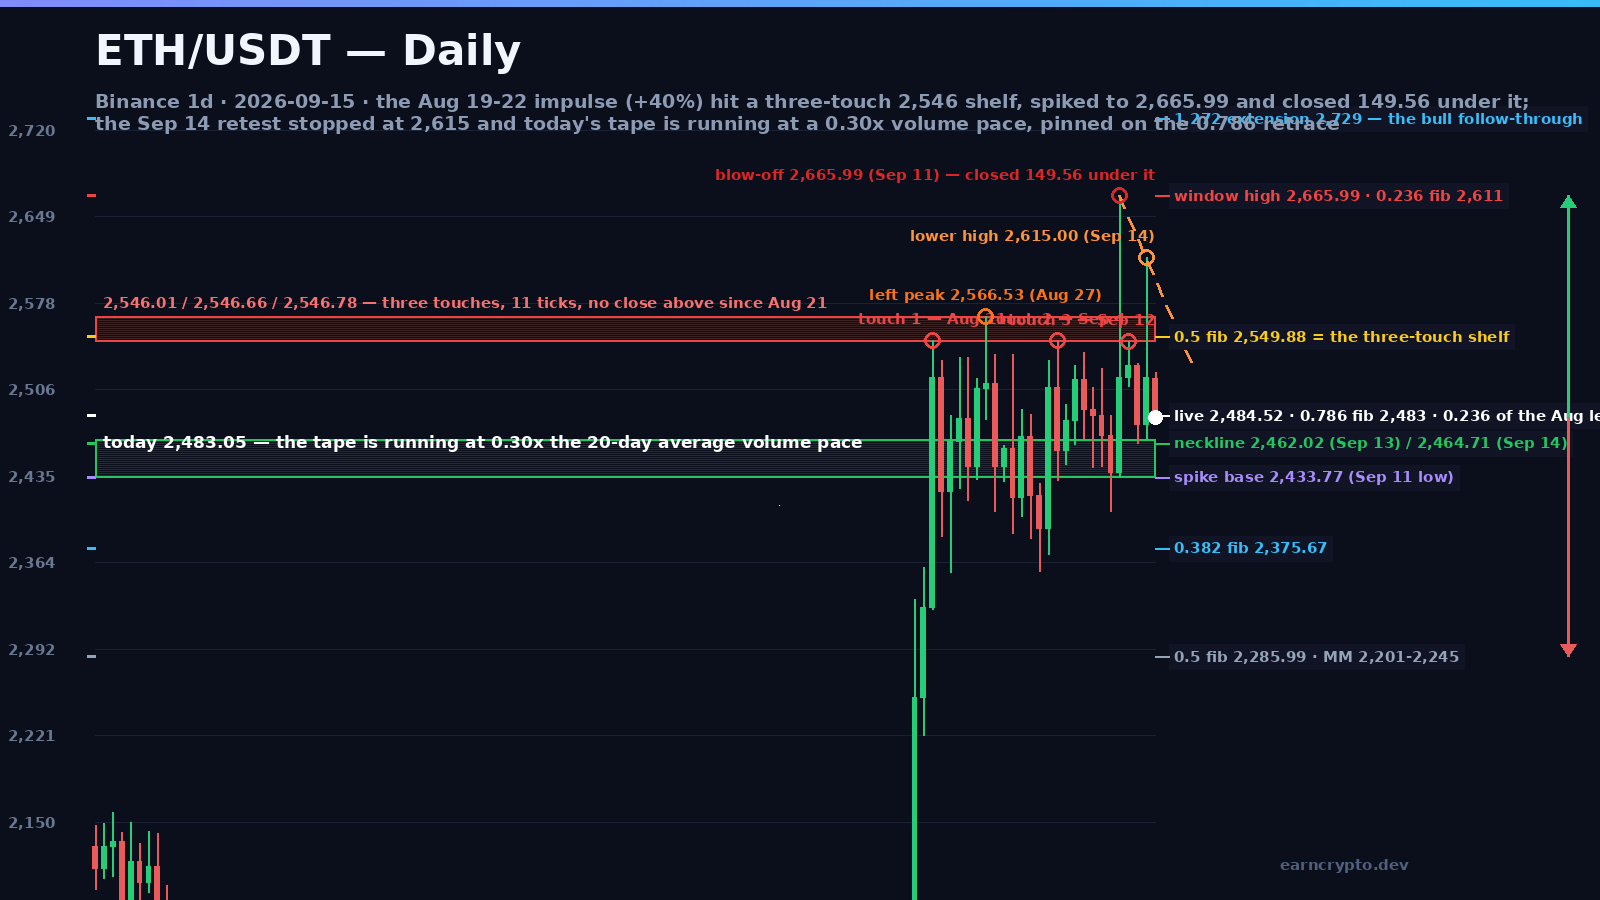
Ethereum closed the session at $2,481.54 after trading a 41-point range — 2,520.00 on the high, 2,479.20 on the low — on 85,551 ETH. That is 0.30x the 20-day average of 289,024 and the lightest daily print since August 15. Thin volume inside a two-week range is not indifference: it is the pause ahead of the two scheduled events of the week, the Senate's cloture vote on Tuesday and an FOMC on Wednesday with hike odds near 90% on the CME — both of which we mapped on Monday.
What matters here is not the silence but where it is happening. Since August 22 Ethereum has held a 2,385-2,666 box, and today's close sits 8 points above the 20-day SMA and 271 points above the 50-day. The trend is still up. The pattern, however, is not.
Advertisement
A three-touch $2,546 shelf and a $2,666 spike that gave it all back
Three separate sessions have now been rejected at the same price: 2,546.78 on August 21, 2,546.66 on September 4 and 2,546.01 on September 12. That is a 77-cent band touched three times over four weeks with no daily close above it. The left peak of the structure is higher still at 2,566.53, printed on August 27.
Then came the September 11 session. Ethereum opened at 2,438.27, ran to 2,665.99 and closed at 2,516.43 on 639,602 ETH — 2.28x the 20-day average, the heaviest candle since the August impulse. That is a 232.22-point range, and 149.56 points of it were handed back before the close. Four sessions later the retest only reached 2,615.00, 51 points under the spike, and closed at 2,515.75. Two peak attempts, two failures, the second lower than the first, with a three-touch ceiling underneath both.
Advertisement
Two fibs, one price: the $2,483-$2,487 line
The 0.786 retracement of the spike leg (2,433.77 to 2,665.99) sits at 2,483.47. The 0.236 retracement of the whole August leg (1,906.00 to 2,665.99) sits at 2,486.63. Two independent measurements land inside $3.16, and today's close printed a dollar above the first of them. The same ladder puts the 0.5 fib at 2,549.88 — the shelf itself — and the 0.236 at 2,611.19, 3.8 points under where the September 14 retest died. Price has been walking this ladder for five sessions.
Below, the warning line is the September 13-14 low pair at 2,462.02 and 2,464.71. The actual neckline of the double top is lower, at the spike candle's own low of 2,433.77, and it has not been touched since it was printed.
BULL case — reclaim the shelf and the spike is back in play
A daily close back above 2,546-2,550 (shelf plus 0.5 fib) reopens 2,611-2,615, then the spike high at 2,665.99. Only a close above the spike opens the 1.272 extension at 2,729 and puts the 2,812 Murrey level in play. The path there will not be a straight line: expect a rejection candle at the shelf, a pullback into 2,500-2,510 that holds the 20-day SMA, and a second push that actually closes above it. Probability around 45% while the 20-day SMA at 2,473.30 keeps absorbing the dips; the bull case dies on two consecutive closes under 2,462.
BEAR case — a $2,433 sweep opens the 2,245 count
Lose 2,462 on a close and the September 11 low at 2,433.77 becomes the magnet. Under it, the September 10 low at 2,405.85 is the first shelf, then the 0.382 fib of the August leg at 2,375.67. The measured move of the spike range is the number to keep in the drawer: 2,433.77 minus 232.22 equals 2,201.55, and that lands inside the August 19-20 breakout base at 2,221-2,333. That is the 2,200-2,245 objective, and it is where the August buyers who chased the impulse would be forced to defend. Probability around 55% while price sits under the shelf and every rally since September 11 has been sold into.
RSI(14) is 57.9, the 20-day SMA is 2,473.30, the 50-day is 2,210.05 and ATR(14) is $93.27, or 3.8% of spot. That ATR is the reason a stop placed under the shelf gets taken out by noise before the level itself breaks: at this volatility a 2,433 sweep is a normal day, not an event.
A 232-point spike that gives back 150 of it by the close is a supply print, not a breakout. Until a daily close clears 2,550 I treat every push into the shelf as a fade — and the 2,433.77 sweep as the trade I actually want to buy.
So the week resolves on one number. Hold 2,462-2,487 and Tuesday's vote plus Wednesday's FOMC can still carry Ethereum through the shelf toward the 2,666 high and the 2,729 extension. Lose it, and the measured move at 2,201-2,245 is the honest target. Everything in between is noise dressed as a decision.
Levels and live candles: ETH/USDT on Binance · Ethereum on CoinGecko · ETH/USDT chart on TradingView · earlier ETH roadmap: the $2,550 liquidity wall and this week's two votes
Written by
EarnCrypto.dev Editorial
The EarnCrypto.dev editorial team researches and reviews AI mining platforms, pools and earning tools — publishing only what passes our own checks.
Related reading

SOL Daily Analysis — Three Touches Under the $120.00 Round Number: The 114.29 Retrace Decides 126.56 or 105.05
Solana has been rejected at the $120.00 round number three sessions in a row after a 25% week. The $114.29 retrace decides whether 126.56 or 105.05 comes next.

BTC Daily Analysis — The 82,300 Box Broke: The 87,396 Double Touch Decides 90,776 or 82,648
Bitcoin broke its five-week $82,300 box on 21 September and has coiled under $87,396 since. The $84,463 retrace decides whether 90,776 or 82,648 comes next.

BNB Daily Analysis — The $780.64 Ceiling Broke: The 782.98 Retrace Decides 858 or 741
BNB cleared the $780.64 ceiling that had held since September 5 and reversed to 782.75 today, two ticks off the 782.98 retracement. The measured move is 858.