
LTC Weekly Analysis — Measured Move Filled at $55.42: The $52.46 Fib Decides 59.5 or 47.4
Litecoin filled its 7.14-point base projection at $55.42, then got sold at $59.46. The 0.618 at $52.46 now decides whether the base extends or unwinds.
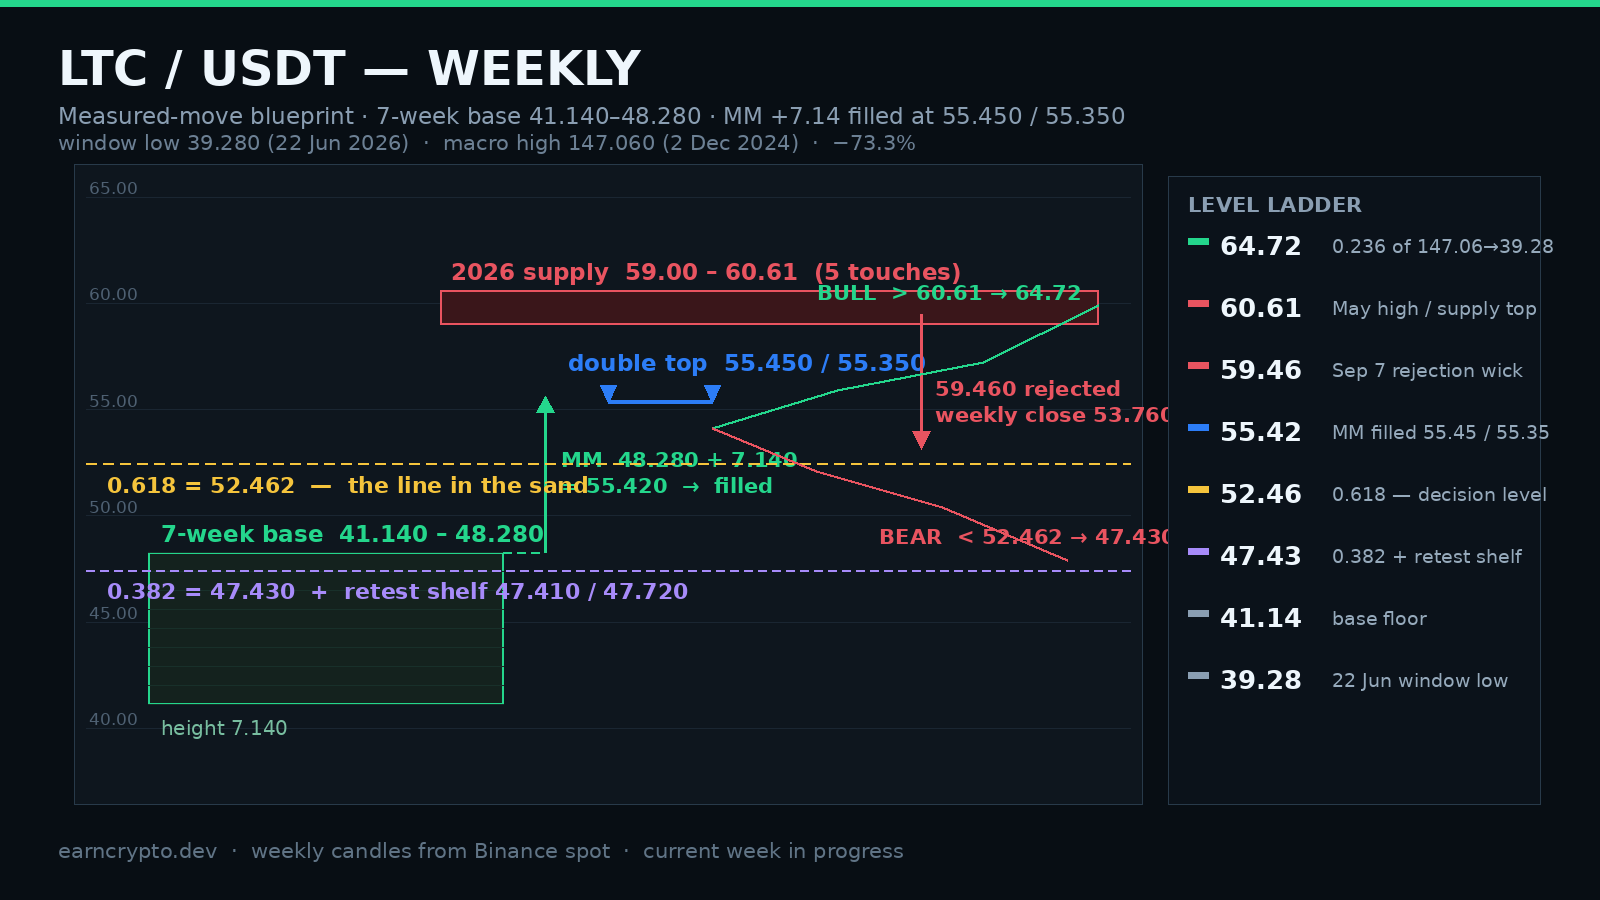
The 120-week window opens on 2024-06-03 at $80.49 and closes with the current week at $54.09. The dominant feature is not the decline, it is the interruption. Litecoin peaked at $147.06 in the week of 2024-12-02 and spent eighteen months carving lower highs — $141.22, $140.17, $134.19, $113.71, $84.89 (2026-01-05) and finally $60.61 (2026-05-04) — before the June washout took it to $39.28, 73.3% below the high.
That June low arrived in the week of 2026-06-22, and what followed was seven weeks of nothing: closes of $45.82, $44.01, $47.07, $47.84, $44.69, $45.46 and $44.16, with the extremes pinned between $41.14 and $48.28. Base building looks boring on a weekly chart, which is exactly the point — it is where positions are accumulated, not announced.
Advertisement
Seven weeks of base and a 7.14-point measured move, filled
The week of 2026-08-17 ended the silence. It opened at $44.16, ran to $55.45 and closed at $52.28 — an 18.4% weekly gain on 3.24 million LTC, roughly 2.7x the weekly average during the base. That candle cleared the seven-week ceiling at $48.28 by seven full points in one move, which makes the base height the natural projection: $48.28 plus $7.14 equals $55.42.
The market then did something useful for anyone measuring: it came back. The week of 2026-08-24 dropped to $47.41 and closed at $47.94, a sweep just under the broken ceiling that closed back inside the range — a textbook breakout retest. The following week reclaimed with a $47.72 low and a $54.97 close, printing the second high of the structure at $55.35. Against the original $55.45, that is a double top ten cents wide and a measured move filled within three cents of the projection. The $55.42 target is done; it is history, not a forecast.
Advertisement
The $59.46 wick into the 2026 supply band
Then came 2026-09-07. The week opened at $54.97, pushed to $59.46 and closed at $53.76 — a 5.70-point upper wick, about 10.6% of the close. Volume was 2.51 million, below the breakout week's 3.24 million. A breakout attempt that stops $0.99 short of $60.61 and gets sold back to the middle of its own range with declining volume is supply doing its job.
The $59.00–$60.61 band is not new. It has now been touched five times in 2026: $59.00 (2026-02-23), $59.26 (2026-03-16), $60.61 (2026-05-04), $60.59 (2026-05-11) and $59.46 (2026-09-07). This is the highest-quality resistance on the weekly chart, and it is the reason the path to a full trend reversal has to go through $60.61 rather than around it.
Bull case: $52.462 holds and the base becomes a flag
The current week is coiling just under the double top — open $53.76, high $54.60, low $53.59, last $54.09. The relevant fib is the 2026 leg from $60.61 down to $39.28 (range $21.33): 0.382 at $47.428, 0.500 at $49.945, 0.618 at $52.462 and 0.786 at $56.045. Spot is holding above the 0.618, and the retest lows of the previous two weeks — $47.41 and $47.72 — sit within two ticks of the 0.382. Nearly every level this market has respected in the last two months comes from that one measurement.
If $52.462 keeps holding on a weekly close, the natural path is another run at $55.35–$55.45, then the $56.05 zone (the 0.786), then the $59.00–$60.61 band. A weekly close above $60.61 does two things at once: it breaks the sequence of 2026 lower highs and it activates a second projection of the same base — $48.28 plus 2 × $7.14 equals $62.56. Above that, the 0.236 retracement of the entire $147.06-to-$39.28 macro leg sits at $64.72. Expect chop, not a straight line: the weekly ATR(14) is $5.25, 9.7% of spot, so a normal week can swing five points without invalidating anything.
Bear case and what invalidates each side
The bear version is that the 5.70-point rejection wick was the top of the move, not a pause. The double top at $55.4 is a two-touch ceiling, the 0.786 at $56.045 is unbroken, and the supply band above has five touches behind it. Losing $52.462 on a weekly close resets the whole sequence: the 0.500 at $49.945 comes next, and then the confluence shelf where the 0.382 at 47.428, the retest lows at $47.41/$47.72, the old base ceiling at $48.28 and the 0.618 of the breakout leg at $48.00 all sit inside a one-point band.
That shelf is the whole trade. It held once as support and once as a floor during the retest. A weekly close below $47.41 kills the seven-week base breakout outright, and the next reference points are the base floor at $41.14 and the June low at $39.28. For the bears to be proven wrong rather than merely delayed, the market has to print a weekly close above $60.61 — anything less leaves the 2026 trend of lower highs technically alive.
The measured move was filled to the cent, and the market said thank you by selling the next extension. Above $60.61 the trend changes; below $47.41 the base never happened.
The chart above is frozen on real Binance weekly candles and replays in order: the seven-week base, the measured-move projection that was filled, the three-touch supply band and the two scenario paths. Weekly structure like this is published on EarnCrypto every week.
Written by
EarnCrypto.dev Editorial
The EarnCrypto.dev editorial team researches and reviews AI mining platforms, pools and earning tools — publishing only what passes our own checks.
Related reading

SOL Daily Analysis — Three Touches Under the $120.00 Round Number: The 114.29 Retrace Decides 126.56 or 105.05
Solana has been rejected at the $120.00 round number three sessions in a row after a 25% week. The $114.29 retrace decides whether 126.56 or 105.05 comes next.

BTC Daily Analysis — The 82,300 Box Broke: The 87,396 Double Touch Decides 90,776 or 82,648
Bitcoin broke its five-week $82,300 box on 21 September and has coiled under $87,396 since. The $84,463 retrace decides whether 90,776 or 82,648 comes next.

BNB Daily Analysis — The $780.64 Ceiling Broke: The 782.98 Retrace Decides 858 or 741
BNB cleared the $780.64 ceiling that had held since September 5 and reversed to 782.75 today, two ticks off the 782.98 retracement. The measured move is 858.