
SUI Weekly Analysis — An Ascending Base Broke on Record Volume: The $1.2947 Gate Decides 1.59 or 0.95
SUI broke a six-week 0.6354-0.9540 base on 897M tokens, the heaviest weekly volume in 85 weeks, and is holding 88% above its sweep low. The 1.2947 gate decides.
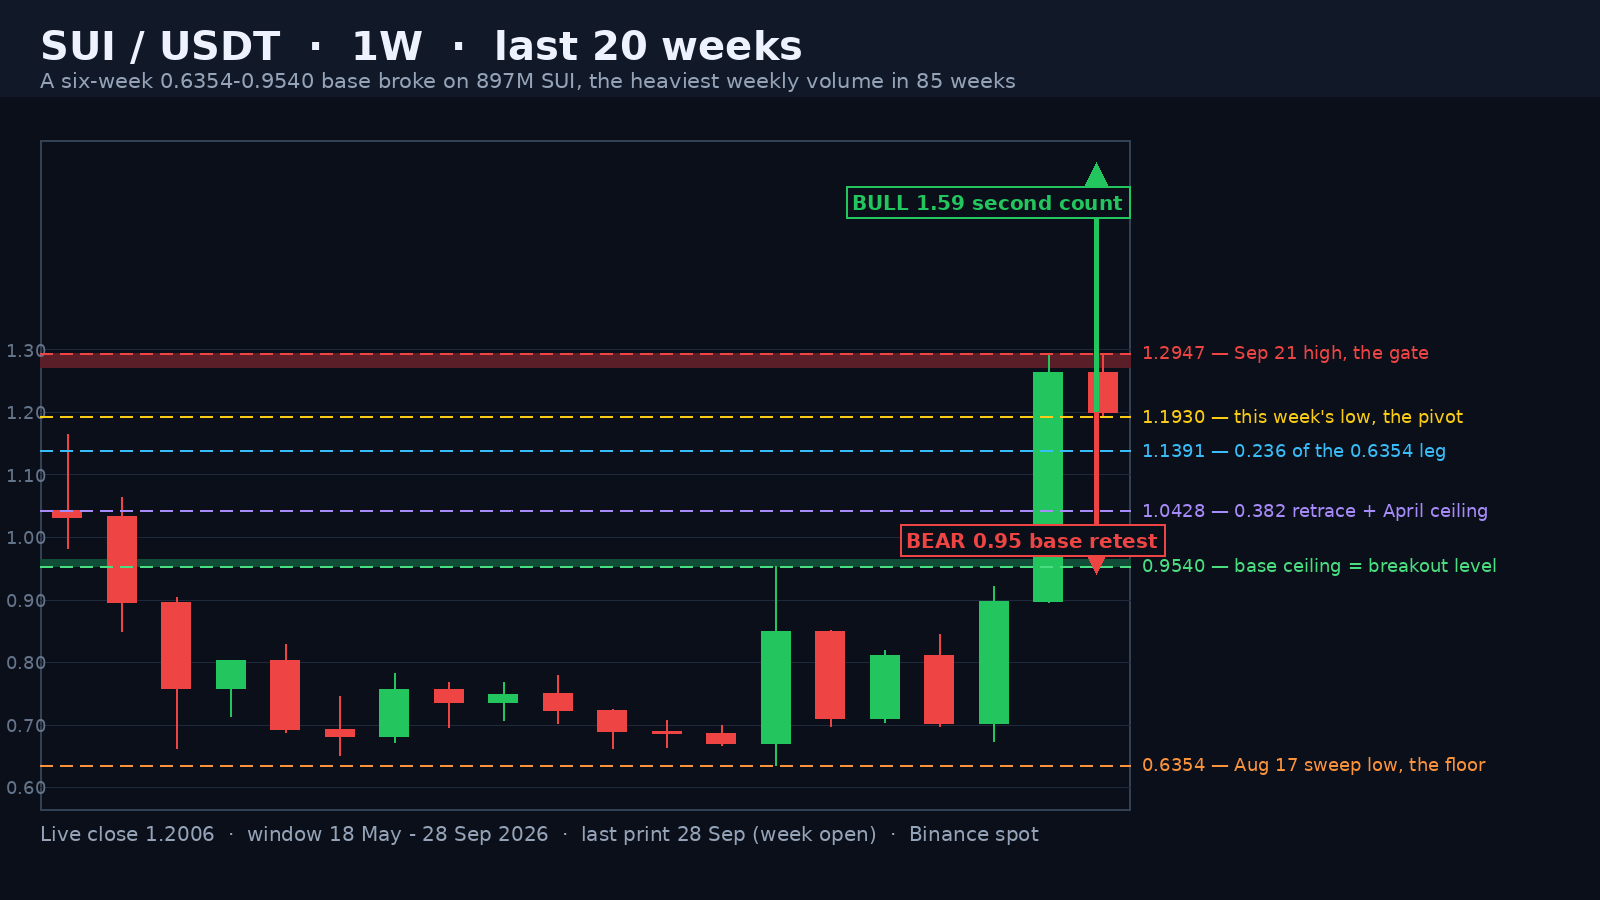
Six weeks of base, one week of everything
SUI closed the September 21 week at 1.2640 — 40.8% above its open, 32.5% above the 0.9540 lid that had capped the market since August 17, and 98.9% above the 0.6354 sweep low of that same week. The candle traded 897.4M SUI: the heaviest weekly volume in 85 weeks and 2.4x the twenty-week average.
The base it broke is worth describing, because every target on this chart is measured from it. Between the August 17 sweep week and September 14 the market never closed outside 0.7018-0.8974 — five weekly closes (0.8504, 0.7111, 0.8118, 0.7018, 0.8974) inside a 0.20 range, with highs of 0.9540, 0.8509, 0.8193, 0.8447 and 0.9209 all rejected and lows of 0.6354, 0.6969, 0.7038, 0.6977 and 0.6730 refusing to make a lower low. Six weeks of compression, and compression resolves on a weekly close — never on a wick. It closed 32.5% through the lid.
Advertisement
The 50-week average is back, for the second time this year
The trend work is the quieter half of this move. The 50-week average sits at 1.1221, and the last two weekly closes — 1.2640 and the current week — are the first back-to-back closes above it since January. The previous reclaim, the week of May 4 at 1.3325, lasted exactly one week before the market lost it on the way to 0.6354. That history is why 1.1221 matters more than the percentage gain.
There is no moving-average resistance anywhere near the price — the 20-week average at 0.8158 is 32% under spot — and the weekly RSI at 57.7 is the coolest reading of any large cap that has repriced this quarter; LINK, the other name in this week's weekly review, is at 63.1. Stretched momentum is not the risk here. The risk is that the breakout was one candle of forced buying.
Advertisement
What the base pays, in both directions
The base is 0.3186 tall, from 0.6354 to 0.9540. Its first measured move at 1.2726 has been pricked — the September 21 high printed 1.2947, 1.7% above the count — but the week closed 1.2640, 0.7% under it, so the count is not filled on a closing basis. Close above 1.2726 and the second count at 1.5912 becomes the objective; a weekly close above 1.4223, the May 2026 high, would be the first since that month.
The path is not a straight line. A realistic bull sequence is a first push into 1.2680 that gets sold at the gate, a pullback that holds 1.1930 and the 0.236 at 1.1391, and then two closes above 1.2947 — after which 1.3325, 1.3517 and 1.4223 are the ladder to 1.5912. The September 21 candle was 39.5% tall from low to high; assuming the next three weeks hold that pace is how traders get shaken out of a move that is structurally intact.
The bear case is cheaper to execute and needs less volume. Lose 1.1930 on a weekly close and the market is back at the 0.236 (1.1391); lose that and 1.0428 — the 0.382, four ticks from the April 13 ceiling — is the next shelf. Under it, the 0.5 at 0.9650 sits one tick above the 0.9540 base ceiling, so a retest of the breakout level and the half retracement of the leg arrive together. That is why 0.9540 is the line that decides whether this was a breakout or a failed squeeze.
The two closes that decide it
A weekly close above 1.2947, with the 50-week average two closes behind it, opens 1.3325 and 1.3517 and then the 1.4223 May high and the 1.5912 second count. A weekly close below 1.1930 hands the market back to 1.1391 and 1.0428, and a close under 0.9540 invalidates the breakout entirely. Between those lines the path of least resistance favours the bulls — but only mildly.
The weekly ATR of 0.1385 is 11.5% of spot, and that is the real message of this chart. In a market that moves 11.5% a week on average, the distance between 1.59 and 0.95 is one bad candle in each direction, which is exactly why the closing levels matter and the intraweek prints do not.
A six-week base that resolves on the heaviest weekly volume in 85 weeks is not a pump — it is this token being repriced against everything it lost in 2026. The level that decides it is 1.1930: keep closing above it and 1.5912 is arithmetic, lose it and the whole move is a retest of 0.9540.
The daily structure was already coiled at $1.00 before this candle, as the SUI daily analysis of 25 September mapped it — and the low-beta version of the same rotation is this week's LINK weekly analysis.
For the method behind the 1.2726 and 1.5912 counts, the LTC weekly analysis from two weeks ago shows the same base-height arithmetic with the target already filled to the cent.
Written by
EarnCrypto.dev Editorial
The EarnCrypto.dev editorial team researches and reviews AI mining platforms, pools and earning tools — publishing only what passes our own checks.
Related reading

SOL Weekly Analysis — A 17-Week Doubling Topped Twice at 124.95 / 123.76: The 116.32 Neckline Decides 124.95 or 100.19
SOL doubled 107.8% in 17 weeks into a 124.95 / 123.76 two-touch top and paid its 108.29 count to 105.71. The 116.32 neckline decides 124.95 or 100.19.

AVAX Weekly Analysis — A 55.2% Thrust and Four 2x-Volume Weeks Under a 12.008 Two-Touch Top: The 10.866 Retrace Decides 14.25 or 8.387
AVAX ran a 55.2% week on 2.27x volume, then coiled four weeks under an 11.799 / 12.008 two-touch top. The 10.866 line decides 14.25 or the 8.387 count.

ETH Daily Analysis — A 2,392.96 Count 94% Filled and Five Rising Lows Back at the 0.382: The 2,635 Line Decides 2,777 or 2,406
ETH's 2,807/2,600 distribution left a 2,392.96 count that went 94% filled at 2,406.11. Five rising lows have retaken the 0.382 — 2,635 decides 2,777 or 2,406.