
SUI Daily Analysis — Rising Coil at $1.00 After a 61% Leg: The 0.9324 Double Floor Decides 1.2306 or 0.8772
Sui rallied 61% in seven sessions to a 120-day high at $1.0815 and now holds $1.00. The 0.9324 double floor decides whether 1.2306 or 0.8772 comes next.
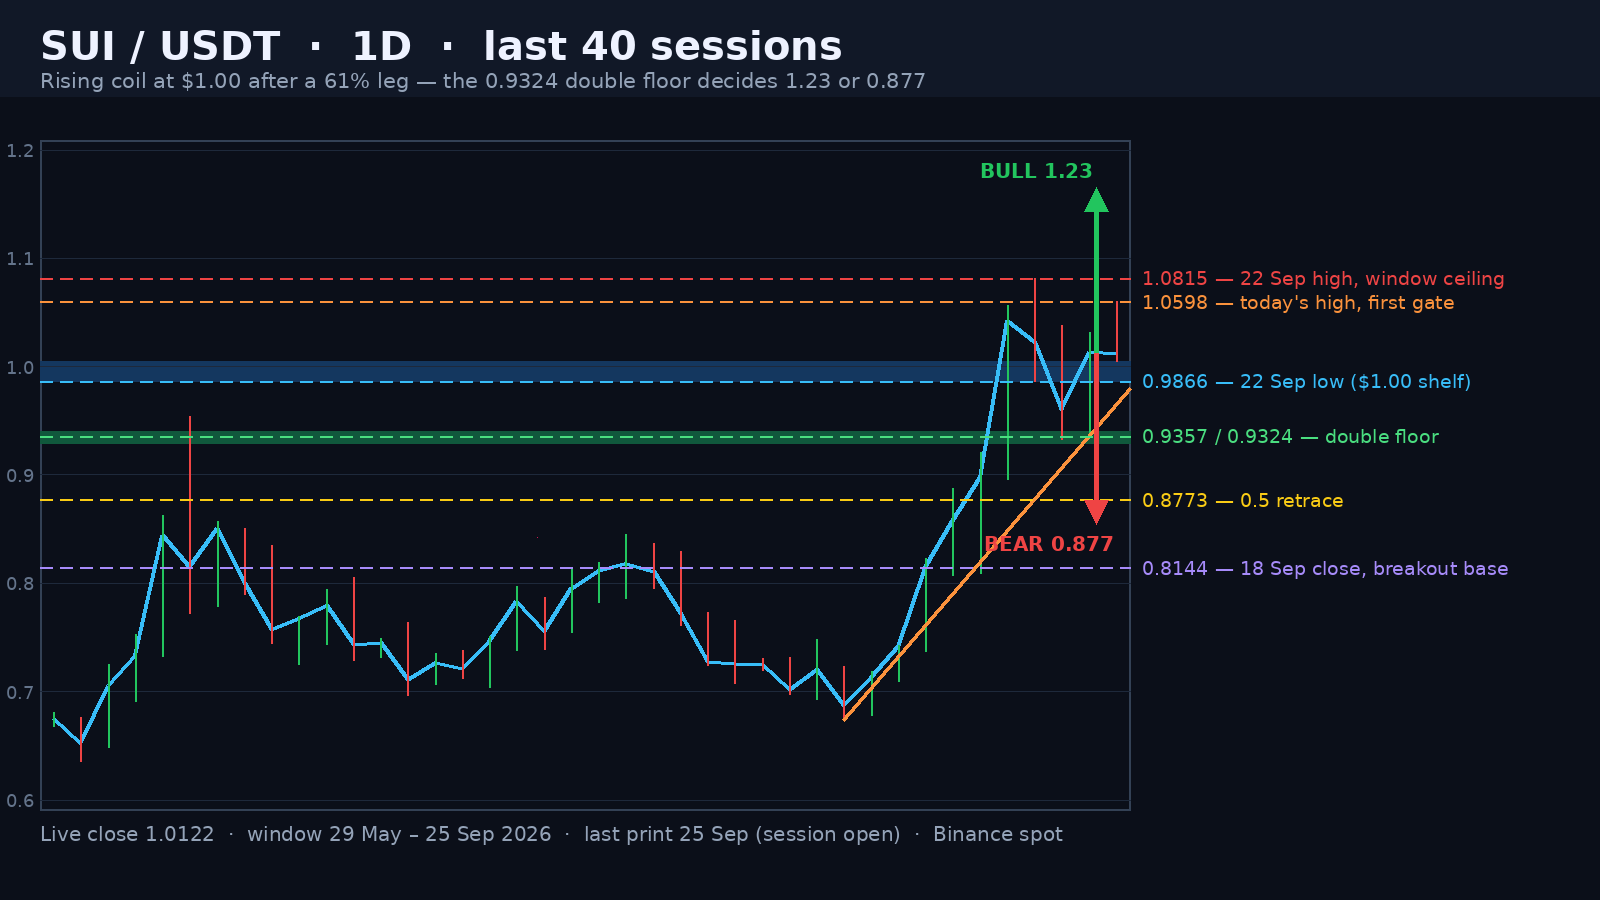
Sui is trading at 1.0143 mid-session on 25 September, 6.21% under the 120-day high it set on 22 September at 1.0815 and 60% above the 18 August low of 0.6354. Today's range is 0.0548 — 5.40%, the tightest of the last six sessions — on a 0.28x volume pace against the 20-day average of 95,113,829 SUI. A quiet session is exactly what a market needs after a vertical move; the question is which floor it is standing on.
Seven Sessions, 61%, and the Heaviest Candle in the Window
The leg began at the 15 September low of 0.673 and ended at the 22 September high of 1.0815: 60.70% in seven sessions. It was not a thin squeeze. Volume ran 122.3M tokens on the 18 September breakout close at 0.8144, 132.8M on the 19th, 134.8M on the 20th and then 239.7M on the 21st — the heaviest print of the entire 120-candle window, carrying price from the 0.8974 close of the 20th to a high of 1.0566 in one session. The $0.84 wall this site flagged in our 30 August piece on SUI's ETF inflows gave way on 19 September with a close at 0.8575, and the market has not traded back below it since.
Advertisement
Three Sessions of Higher Lows Under the High
Since the 1.0815 print the market has behaved like the opposite of a blow-off. The lows read 0.9324 on the 23rd, 0.9357 on the 24th and 1.0050 today; the highs read 1.0379, 1.0315 and 1.0598. Range has compressed from 10.99% to 9.45% to 5.40%. Rising lows with a tightening range under a high is accumulation-shaped rather than distribution-shaped — with the honest caveat that four sessions is a short sample and one bad day erases the pattern.
The 0.382 That Held Twice and the $1.00 Pivot
The retracement ladder of the 0.673-1.0815 leg reads 0.9851 (0.236), 0.9255 (0.382), 0.8772 (0.5) and 0.8290 (0.618). The two lows of this consolidation stopped 0.75% and 1.11% above the 0.382 — the closest touches the market has given it — and the 22 September low of 0.9866 sits just 0.15% above the 0.236. In between, price has spent four sessions pivoting around the round $1.00 with the 0.9866-1.0050 shelf underneath. A shallow 0.236-to-0.382 retrace after a 61% leg is what a market does when buyers keep arriving before the fibs.
Advertisement
The Box Projects 1.2306
The consolidation is 0.1491 points tall from 0.9324 to 1.0815, and a break of its top projects 1.2306. The leg's own extensions are 1.1926 (1.272) and 1.3340 (1.618), and half the pole measured from the high gives 1.2857. So the resistance cluster after the high is 1.19 to 1.23, and it takes a close above 1.0815 to unlock it. Without that close, 1.0598 and 1.0815 stay as gates, not targets.
Scenarios and the Invalidation
Below, 0.9866 is the first shelf, then the 0.9324-0.9357 double floor with the 0.382 at 0.9255 directly under it. A daily close below 0.9255 opens 0.8772 (the 0.5), 0.8290 (the 0.618) and the 18 September close at 0.8144, which is the base of the vertical leg. The bear case dies on a close above 1.0815; the bull case dies on a close below 0.9255.
A 61% seven-session leg almost never continues without a base, and the market is building one at $1.00. Rising lows and a 5.4% range are the first honest sign of it — but the 0.9324 floor is what keeps the whole structure intact.
The honest risk is in the arithmetic. RSI(14) is 68.20 — extended rather than exhausted — price sits 22% above the 20-day average at 0.8289 and 32% above the 50-day at 0.7703, and the 14-day ATR is 0.0693, or 6.8% of spot. One average day from here reaches either the 0.9324 floor or the 1.0815 gate, which is why this consolidation can end abruptly in either direction.
The path of least resistance stays up while 0.9255 holds, and the lean is closer to 55/45 than to a forecast, because a leg this steep usually needs either a deeper 0.382 to 0.5 test or a longer base before the next extension. Watch two lines: 1.0815 above, 0.9324 below.
Binance SUI/USDT live chartOur 30 August piece on SUI's ETF inflows and the $0.84 wallSui market data on CoinGeckoWritten by
EarnCrypto.dev Editorial
The EarnCrypto.dev editorial team researches and reviews AI mining platforms, pools and earning tools — publishing only what passes our own checks.
Related reading

SOL Weekly Analysis — A 17-Week Doubling Topped Twice at 124.95 / 123.76: The 116.32 Neckline Decides 124.95 or 100.19
SOL doubled 107.8% in 17 weeks into a 124.95 / 123.76 two-touch top and paid its 108.29 count to 105.71. The 116.32 neckline decides 124.95 or 100.19.

AVAX Weekly Analysis — A 55.2% Thrust and Four 2x-Volume Weeks Under a 12.008 Two-Touch Top: The 10.866 Retrace Decides 14.25 or 8.387
AVAX ran a 55.2% week on 2.27x volume, then coiled four weeks under an 11.799 / 12.008 two-touch top. The 10.866 line decides 14.25 or the 8.387 count.

ETH Daily Analysis — A 2,392.96 Count 94% Filled and Five Rising Lows Back at the 0.382: The 2,635 Line Decides 2,777 or 2,406
ETH's 2,807/2,600 distribution left a 2,392.96 count that went 94% filled at 2,406.11. Five rising lows have retaken the 0.382 — 2,635 decides 2,777 or 2,406.