
SOL Weekly Analysis — The $95.82 Sweep Reset the Floor: The $115.76 Gate Decides 125.38 or 93.62
Seven weeks off $60.13 and up 47%, Solana swept $95.82 then reclaimed it. A weekly close over $114.32 opens $115.76 and $125.38; under $95.82 the base breaks.
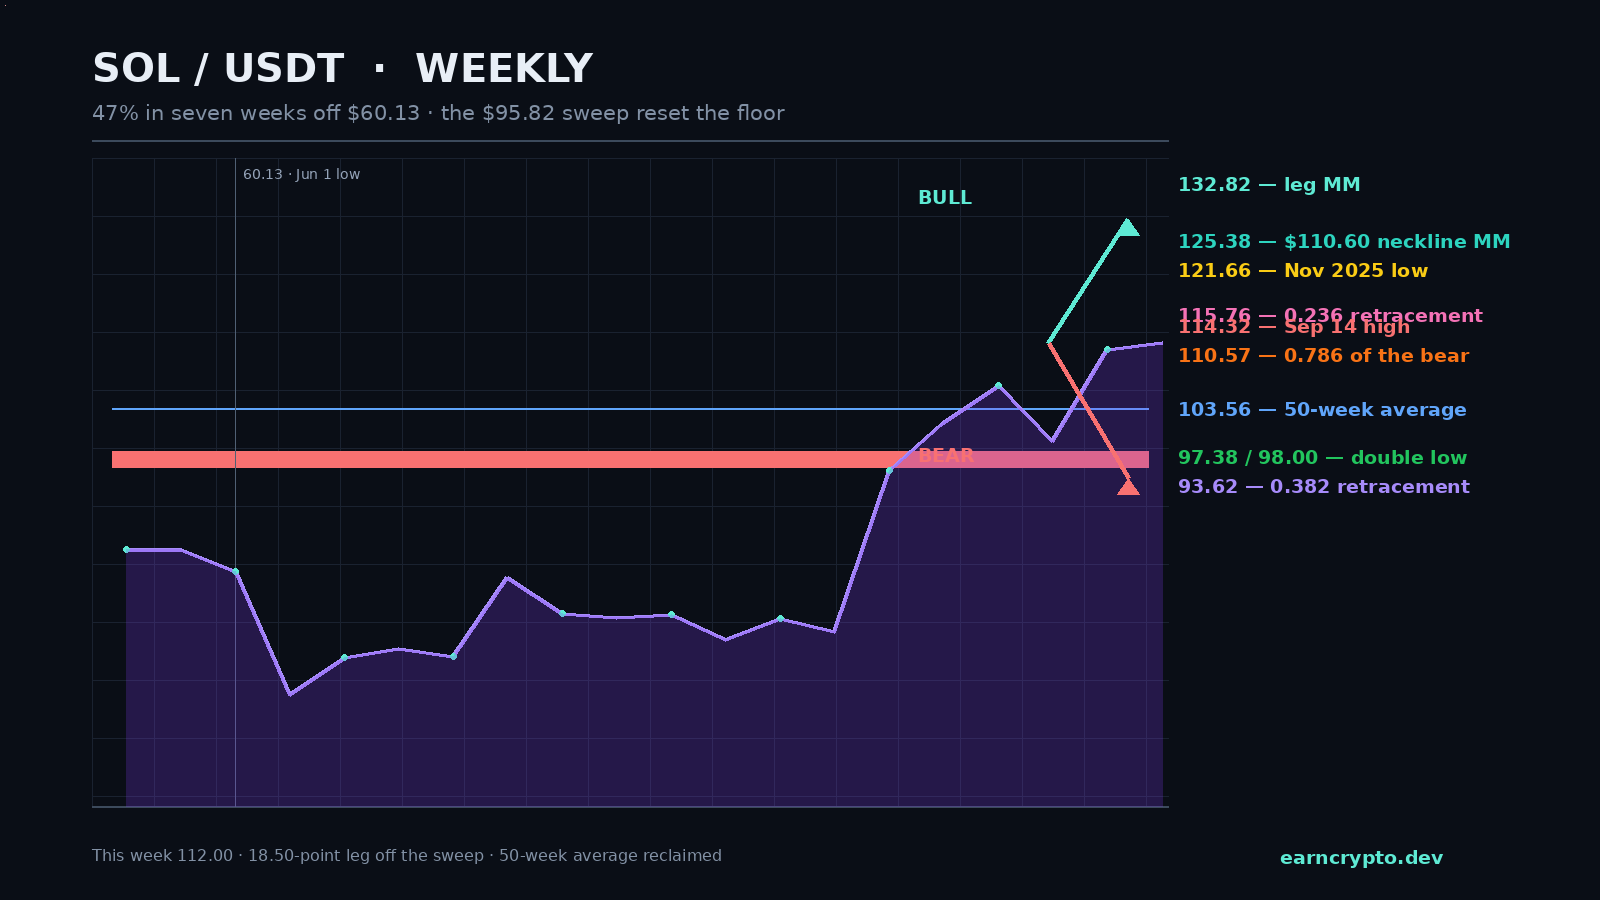
Seven weeks, 47%, and one staircase
Solana closed the June 1 week at 66.50 after printing 60.13 — a capitulation low 79.7% under the January 2025 high of 295.83. Seven weeks later the weekly closes read 95.43, 101.75, 106.55, 99.30, 111.17 and 112.00. That is a 47% recovery off the low with a single 6.8% down week in the middle of it.
The shape matters more than the percentage. The weekly highs since August 17 read 102.74, 110.60, 107.36, 107.06 and 114.32 — a rising sequence with one lower high in the middle — while the lows built a floor at 93.26, 97.38, 98.00 and finally 95.82. This is a staircase, not a spike, and staircases are decided at their last step.
Advertisement
The 0.786 of the bear market is the new support
Zoom out and Solana has still only recovered about a fifth of the 295.83 to 60.13 decline. Measured from the high, the 0.786 line of that entire bear market sits at 110.57, and this week is the first to trade above it since February. The 50-week average at 103.56 has been reclaimed on two consecutive weekly closes — the first time that has happened since the last week of October 2025.
Above the market the Fibonacci ladder is thin: 115.76 is the 0.236 retracement measured from the June low, 121.66 is the November 2025 swing low, and the 0.382 at 150.17 is a different conversation entirely. Below it, the 0.786 at 110.57, the 50-week average at 103.56 and the double low at 97.38-98.00 are stacked inside a 13-point band — a lot of support inside one weekly candle's worth of range.
Advertisement
The sweep that reset the floor
The September 14 week opened 99.31, swept to 95.82 — through both the September 7 low at 98.00 and the August 31 low at 97.38 — and closed at 111.17, 16.0% above the low, on 18.65M SOL. It was the second-heaviest week of the recovery after the August 17 launch, and it did the one thing a broken floor needs: it reclaimed the level it broke, on the same candle.
Volume has climbed with every step of the staircase: 27.17M on the August 17 launch (1.73x the twenty-week average, the heaviest week since June 1), 25.35M the week after, then 15.95M, 14.05M and 18.65M on the sweep. Distribution would look like rising price on falling participation; this is the reverse.
What the levels pay
The bull case is arithmetic. The leg off the sweep low is 18.50 points, so a weekly close above the 114.32 high projects 132.82, and measured from the 110.60 neckline — the top of the August 24 week — the same leg projects 125.38. In between sit the 0.236 retracement at 115.76 and the November 2025 low at 121.66, and both are levels the market has not visited with real volume since last winter.
The path is realistic: a first push into 115.30 that gets sold at the gate, a pullback to 107.25 (the 0.382 of the leg), then a close above 114.32 that opens 116.80, 121.90, a rejection at 124.90 and a final measured-move tag at 125.60 to 132.90. That is a five-week path, not a straight line, and it needs the 0.382 to hold on any retest.
The bear case is cheaper to execute and needs less volume. Lose 110.57 on a weekly close and 107.25 is next; lose that and the market tests the 105.07 half-way line and the 101.75 August 24 close in the same move. The real decision sits at 97.38-98.00 — the double low that has already been broken once — and a weekly close under 95.82 would put the 0.382 of the recovery at 93.62 and the 87.23 half-way line back in play, with the June base top at 83.98 as the honest objective.
The two closes that decide it
A weekly close above 114.32 invalidates the range ceiling and opens 115.76 and 125.38; a weekly close below 95.82 invalidates the entire staircase and reopens 93.62 and 87.23. Between those two lines volatility is high in both directions — the 14-week ATR is 10.41, 9.3% of spot — and that is precisely why the closes, not the wicks, are the thing to watch.
The weekly RSI at 76 is the one caution flag: hot readings in a recovery off a 79% drawdown are normal, but they also mean the easy part of the bounce is behind the market. The path of least resistance stays upward while 103.56 holds, and the asymmetry favours the bulls because the floor at 97.38-98.00 has two touches and a Fibonacci measurement behind it, while the ceiling at 114.32 has one.
A 47% recovery that never closes below its own 50-week average is not a dead-cat bounce — it is a market that has stopped making lower lows. The level that decides this one is 95.82: as long as it stays a wick, the staircase keeps climbing, and the 0.236 at 115.76 is the next door.
Solana is not moving alone: AVAX broke to a 120-day high on the same bid, and XRP is testing its own twelve-touch ceiling as the majors rotate.
Measured moves are only as good as the base they are measured from. For a cleaner read on how range arithmetic plays out in this market, last week's LTC weekly analysis shows the same method with the target already filled.
Written by
EarnCrypto.dev Editorial
The EarnCrypto.dev editorial team researches and reviews AI mining platforms, pools and earning tools — publishing only what passes our own checks.
Related reading

SOL Daily Analysis — Three Touches Under the $120.00 Round Number: The 114.29 Retrace Decides 126.56 or 105.05
Solana has been rejected at the $120.00 round number three sessions in a row after a 25% week. The $114.29 retrace decides whether 126.56 or 105.05 comes next.

BTC Daily Analysis — The 82,300 Box Broke: The 87,396 Double Touch Decides 90,776 or 82,648
Bitcoin broke its five-week $82,300 box on 21 September and has coiled under $87,396 since. The $84,463 retrace decides whether 90,776 or 82,648 comes next.

BNB Daily Analysis — The $780.64 Ceiling Broke: The 782.98 Retrace Decides 858 or 741
BNB cleared the $780.64 ceiling that had held since September 5 and reversed to 782.75 today, two ticks off the 782.98 retracement. The measured move is 858.