
XRP Daily Analysis — A Twelve-Touch Ceiling at $1.45: The $1.37 Pivot Decides 1.55 or 1.15
XRP has printed twelve separate daily highs inside the 1.433–1.476 band since August 21 — the 1.37 pivot decides a 1.547 retest or a slide to the 1.155 fib.
The August spike left a band nobody has cleared
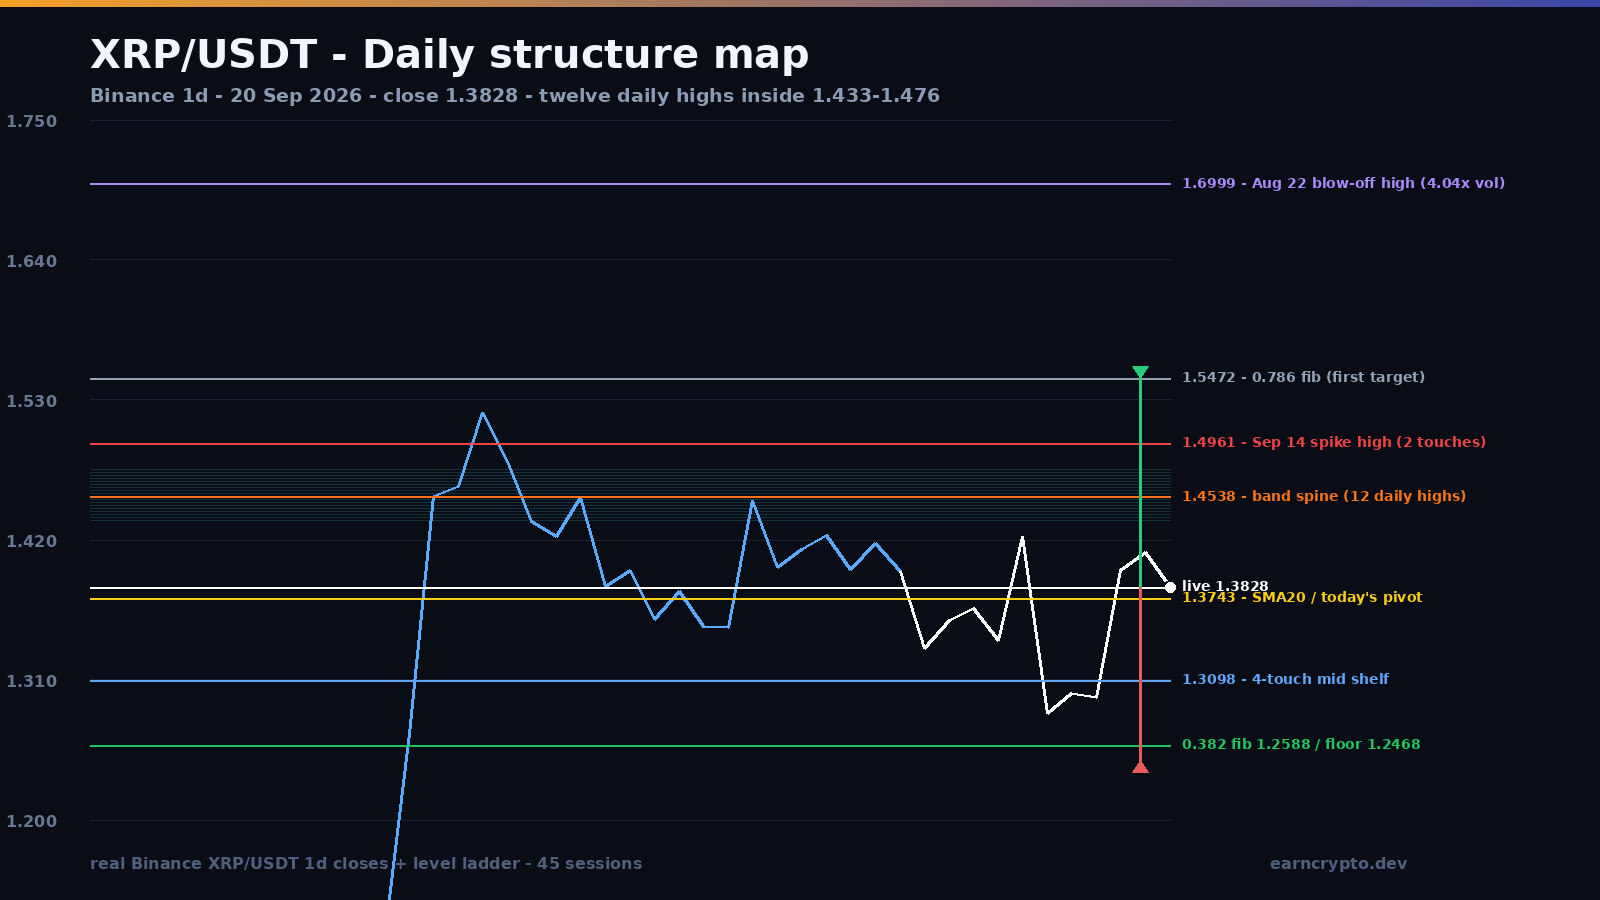
On August 22 XRP printed 1.6999 on 588,303,506 tokens — 4.04x the twenty-day average and the heaviest session of the window — and closed at 1.4619. A 0.238 upper wick is not a breakout, it is a transfer: the market handed stock to whoever was willing to buy strength, and then stopped bidding. Three weeks of decline followed, down to 1.2468 on September 16.
That low matters because of where it stopped. The 0.382 retracement of the 0.9862 to 1.6999 leg sits at 1.2588 — twelve ticks above it — and the August 21 low at 1.2588 had already tested the same rung. So the 1.25 shelf now has two real touches and one Fibonacci measurement behind it. That is the floor of everything below.
Advertisement
Twelve daily highs inside four cents of each other
Since August 21, the 1.433–1.476 zone has absorbed twelve separate daily highs: 1.4756 (Aug 21), 1.4513 (Aug 26), 1.4740 (Aug 27), 1.4726 (Aug 28), 1.4335 (Aug 30), 1.4625 (Sep 4), 1.4327 (Sep 6), 1.4507 (Sep 8), 1.4458 (Sep 9), 1.4336 (Sep 11), 1.4598 (Sep 15) and 1.4538 (Sep 19). No other level in this 120-session window has been tested that many times.
Above the band there is one more rung: 1.4835 on September 3 and 1.4961 on September 14. And since August 24 closed at 1.4817, twenty-seven sessions have passed without a single close above 1.47 — which is exactly why a break of it, if it comes, will not be quiet.
Advertisement
This week tested the ceiling twice and was sold both times
September 14 ran 6.11% into 1.4961 on 1.62x volume, the highest print since the spike, and September 15 answered with a 9.82% close lower at 1.2833 on 2.12x. That is a failed breakout, and the market paid the entire band back in a single session. September 18 printed the mirror image — a 7.71% close at 1.3963 on 1.45x — and September 19 pushed to 1.4538, the band again, before closing at 1.4104. Two attempts, two rejections.
Today has been one of the quietest sessions of the last six: a 3.10% range against a twenty-day average of 5.77%, drifting from 1.4104 back to 1.3825. That close sits 0.6% above the twenty-day average at 1.3743, which is the pivot the whole structure is now resting on.
What has to hold
The first line is the twenty-day average at 1.3743, with today’s low at 1.3680 just underneath it. Below that the market has the 1.3098 shelf — four touches, on May 27, May 31, September 2 and September 11 — and then the 1.2468 floor with the 0.382 fib twelve ticks higher at 1.2588. A daily close under 1.2468 takes out the bottom of the whole range and targets the 0.236 retracement at 1.1546, which is where XRP congested before the August expansion.
The invalidation structure is unusually clean on both sides. For the bull read it is a daily close under 1.2877, the September 17 higher low, which would break the higher-low sequence the floor has been building since September 16. For the bear read it is a close above 1.4961 — the first one since August 23 — which would flip the most-tested band in the window into support and force every seller of the last month to reprice.
The two paths
Bull case: the range measures itself. 1.2468 to 1.4961 is 0.2493, which projects 1.7454 above the ceiling — inside the 1.70–1.75 area that the August spike never closed in. Before that sits the 0.786 retracement at 1.5472 and the 0.5 at 1.3430, already reclaimed on a closing basis. The path of least resistance stays upward while 1.3743 holds, because a floor with two touches and a fib underneath it is a better place to defend than a ceiling with twelve rejections is to attack — the same asymmetry LTC carried into its four-touch ceiling before that break came.
Bear case: it needs nothing more than a third rejection. A close under today’s low opens 1.3098, and a break of that shelf — the way September 15 broke it — puts 1.2468 back on the table with the 1.25 shelf tested for a third time. Six weeks of twelve failed attempts make another rejection a live probability rather than a tail risk, and the BTC daily map shows the same shape forming on the largest book in the market. If 1.1546 gives way from there, the whole post-spike structure has failed.
One more thing is worth watching: breadth. The band has been tested by twelve sessions spread across six weeks, so every rejection has been paid for with volume rather than absorbed without it — and that is why Ethereum’s double-bottom resolution and other majors resolving cleanly while XRP chops is not a coincidence but a rotation: capital is being spent where the structure is already resolved, and this range is still waiting for its resolution.
A band that absorbs twelve daily highs is not resistance — it is supply being worked off. Ranges like this end with a close above the band or with the floor giving way, and the twenty-day average is where the market will declare which one it is.
Written by
EarnCrypto.dev Editorial
The EarnCrypto.dev editorial team researches and reviews AI mining platforms, pools and earning tools — publishing only what passes our own checks.
Related reading

SOL Daily Analysis — Three Touches Under the $120.00 Round Number: The 114.29 Retrace Decides 126.56 or 105.05
Solana has been rejected at the $120.00 round number three sessions in a row after a 25% week. The $114.29 retrace decides whether 126.56 or 105.05 comes next.

BTC Daily Analysis — The 82,300 Box Broke: The 87,396 Double Touch Decides 90,776 or 82,648
Bitcoin broke its five-week $82,300 box on 21 September and has coiled under $87,396 since. The $84,463 retrace decides whether 90,776 or 82,648 comes next.

BNB Daily Analysis — The $780.64 Ceiling Broke: The 782.98 Retrace Decides 858 or 741
BNB cleared the $780.64 ceiling that had held since September 5 and reversed to 782.75 today, two ticks off the 782.98 retracement. The measured move is 858.