
LTC Daily Analysis — Ascending Triangle Breakout: The $59.46 Gate Decides 60.34 or 50.20
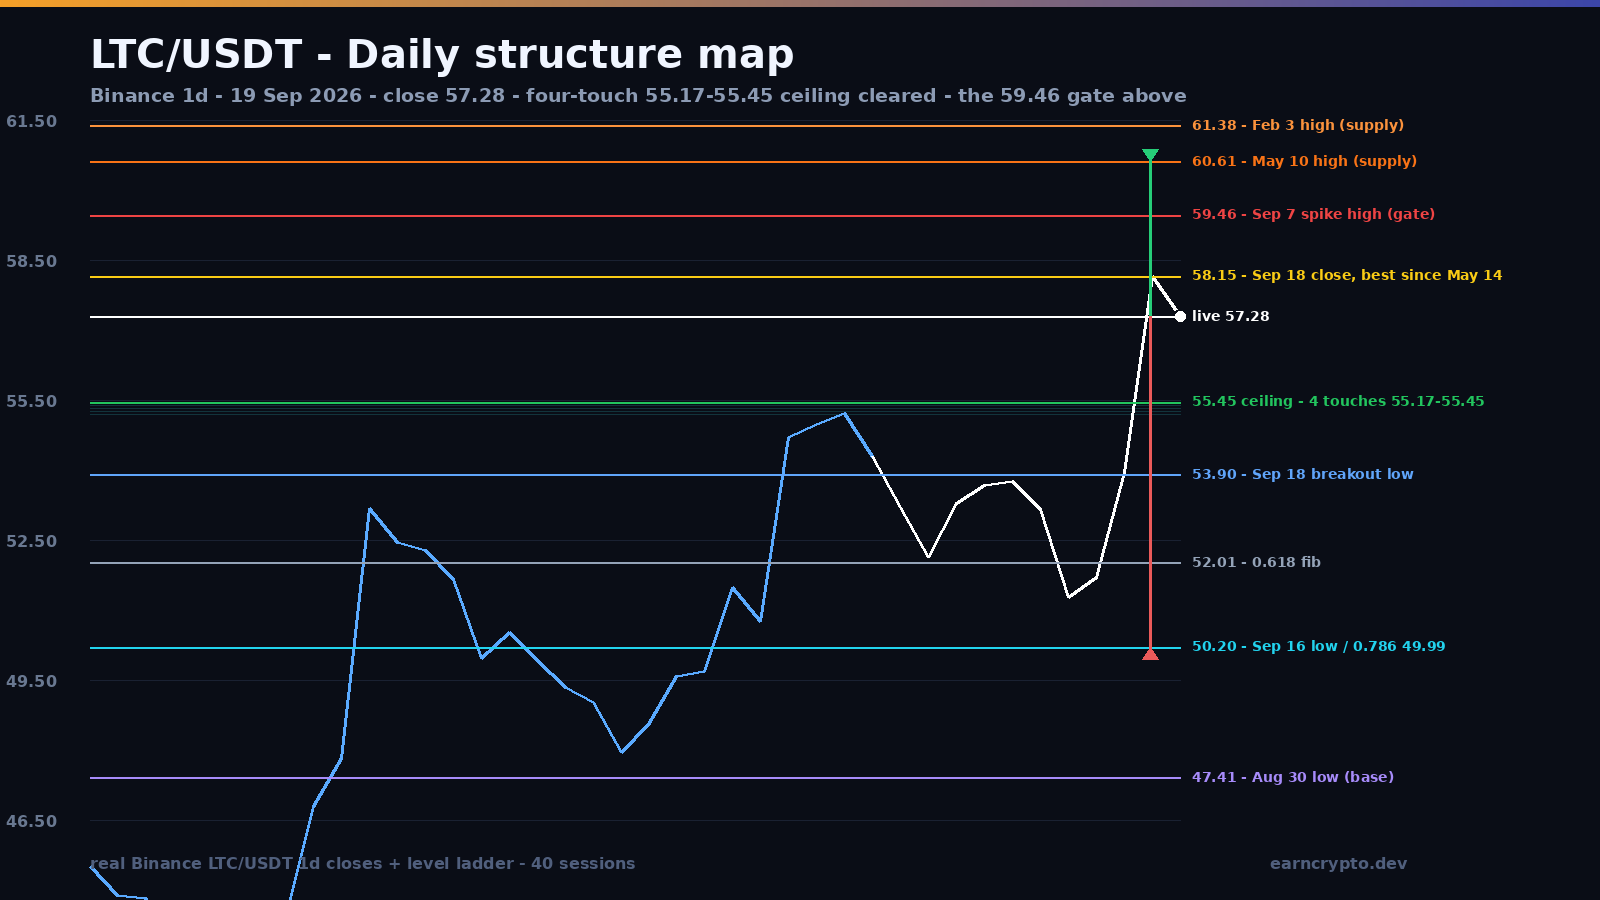
Litecoin closed above its four-touch 55.17-55.45 ceiling on 1.6x volume and now sits only 25 cents under the 59.46 gate — above it 60.34-61.38, below it 50.20.
A flat ceiling over a rising floor
Litecoin spent thirteen sessions building an ascending triangle and closed above it on Friday. The ceiling is the cleanest part: 55.45 on August 22, 55.35 on September 5, 55.17 on September 6 and 55.27 on September 13 — four touches locked inside 0.28 points, the definition of a level the market has agreed on. The floor rose under it the whole time, from 47.41 on August 30 to 50.20 on September 16, with the intermediate lows at 47.72 (August 31), 51.62 (September 10) and 50.77 (September 15).
September 7 was the false move the pattern needed. LTC spiked to 59.46 — the highest print of the 120-candle window — on 684,175 LTC, 1.93x the twenty-day average, and closed at 55.21, 4.25 points below its high. A sweep above a flat ceiling that cannot hold is usually the last thing sellers manage before the real break; nine sessions of corrective drift followed, all the way back to 50.20, without a single close under the August floor.
Advertisement
Friday: a dip below the ceiling, then the best close since May
Friday opened at 53.95, dipped to 53.90 — a full 1.27 points back under the ceiling, which is exactly where a breakout is supposed to be tested — and then ran to 58.21 before closing at 58.15, on 570,777 LTC (1.61x the twenty-day average). That close is 2.70 points above the ceiling, the first close above 55.45 since August 22 and the highest daily close since May 14. Today's session has traded 57.07 to 59.21 with 188,205 LTC traded so far against a twenty-day average of 355,375, and it is holding above the ceiling rather than falling back through it.
The $59.46 gate and the $60.34–61.38 wall
The gate is the September 7 spike high at 59.46 — today's high came within 25 cents of it. Above that level the arithmetic is straightforward. The corrective range that ran from September 8 to September 16 was 5.07 points deep (55.27 to 50.20), and added to its own high that projects 60.34. Sitting right there are two real highs from earlier in the year: 60.61 (May 10) and 61.38 (February 3). A first target with two months of supply parked on top of it is a target that gets sold into, which is why 60.34–61.38 is the zone to watch rather than a number to trust.
Advertisement
If that shelf goes, the triangle's own count takes over. The pattern is 55.45 − 47.41 = 8.04 points tall at its widest, which projects 63.49 above the ceiling. The fibs of the 47.41-to-59.46 leg frame the same picture from below: the 0.236 sits at 56.62 and price has already reclaimed it, while the 0.786 at 49.99 is 21 cents under the September 16 low of 50.20 — the pullback that produced the breakout stopped almost exactly on the 0.786, which is what a healthy retracement looks like.
What would make this a failed breakout
The flip level is the ceiling itself. A daily close back under 55.17–55.45 puts Friday's candle in the same category as the September 7 sweep — a liquidity grab that failed — and the first real warning is a close under 53.90, the low of the breakout candle. Under that, the September range is live again: 51.62, 50.77 and the 50.20 higher low are the rungs, and a close under 50.20 breaks the ascending structure that has been in place since August 30.
Volume deserves the same honesty as ever. The breakout did 1.61x the twenty-day average, which is conviction but not a climax; the heaviest print in the window remains August 22's 949,623 LTC, the day the August impulse was rejected at 55.45. The market has not yet shown the kind of volume that ends a four-month base — it has shown the kind that starts a move.
The frame
RSI(14) closed the week at 69.4, up from 59.5, which puts momentum at the door of overbought without being there yet. The 20-day average at 52.57 sits 9.7% under Friday's close and the 50-day at 49.12 is 15.5% below it. ATR(14) is $2.32, 4.1% of spot — Litecoin is moving four percent a day, so nothing about this should be traded with tight stops. LTC is +8.3% over seven days and +21.6% over thirty, and it has spent the last four sessions proving that 50 is a floor rather than a pause.
While the 55.17–55.45 flip holds on a closing basis, the path of least resistance runs at the $59.46 gate and then the 60.34–61.38 shelf, with the open road to 63 after it. Lose 53.90 and the whole September range reopens. Something in the region of 60/40 in favour of the breakout is the honest lean — the structure supports it, the volume only just does.
Four touches on a flat ceiling above a rising floor is one of the few patterns that tells you in advance where the fight is. The fight was at 55.45, it is over, and now the market has to prove it can take 59.46 — the exact price where it was rejected twelve sessions ago.
The candles behind this analysis are Binance's LTC/USDT daily series; the same triangle and the same ceiling are on TradingView, and the live quote and market capitalisation are on CoinGecko.
Written by
EarnCrypto.dev Editorial
The EarnCrypto.dev editorial team researches and reviews AI mining platforms, pools and earning tools — publishing only what passes our own checks.
Related reading

SOL Daily Analysis — Three Touches Under the $120.00 Round Number: The 114.29 Retrace Decides 126.56 or 105.05
Solana has been rejected at the $120.00 round number three sessions in a row after a 25% week. The $114.29 retrace decides whether 126.56 or 105.05 comes next.

BTC Daily Analysis — The 82,300 Box Broke: The 87,396 Double Touch Decides 90,776 or 82,648
Bitcoin broke its five-week $82,300 box on 21 September and has coiled under $87,396 since. The $84,463 retrace decides whether 90,776 or 82,648 comes next.

BNB Daily Analysis — The $780.64 Ceiling Broke: The 782.98 Retrace Decides 858 or 741
BNB cleared the $780.64 ceiling that had held since September 5 and reversed to 782.75 today, two ticks off the 782.98 retracement. The measured move is 858.