
AVAX Daily Analysis — Vertical Breakout to a 120-Day High: The $9.44 Shelf Decides 11.41 or 8.34
AVAX closed at a 120-day high after a +23% Friday on the heaviest volume of the whole window — the $9.44 digestion shelf decides 11.41 or an 8.34 retest.
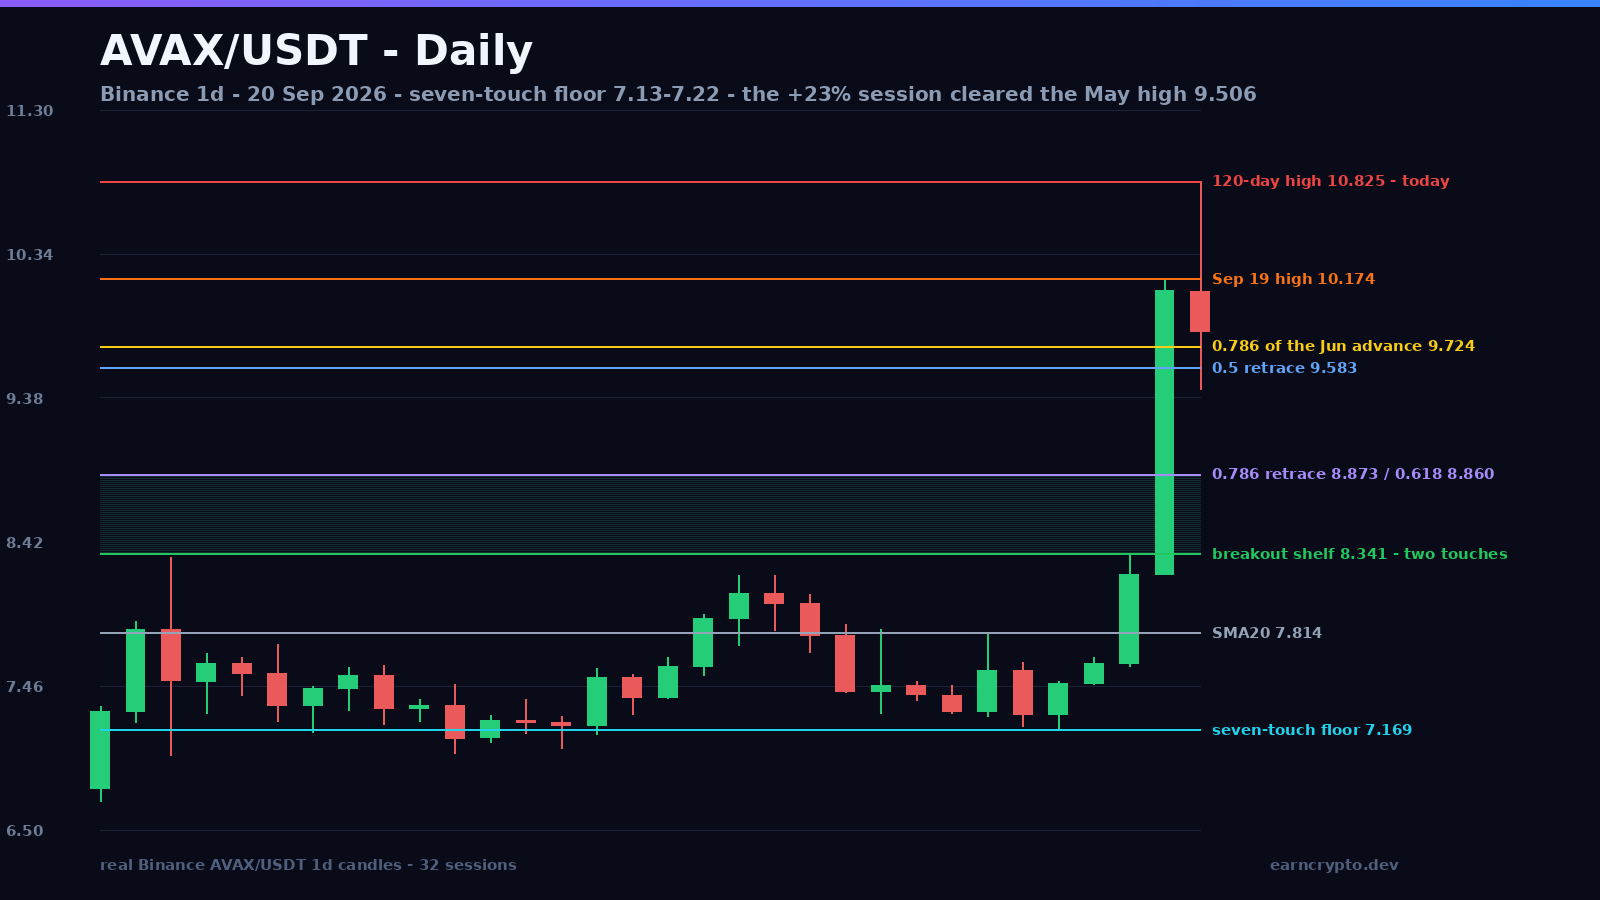
Four weeks of accumulation under an 8.32 ceiling
AVAX spent the second half of August and the first half of September building one of the best-documented bases on the board. The floor sat at 7.13–7.22 and the market tested it seven times between August 21 and September 16 — 7.218, 7.153, 7.205, 7.143, 7.134, 7.189 and finally 7.169. Seven touches inside 9 cents, and every one of them printed on below-average volume: that is what a floor looks like when sellers run out rather than when buyers arrive.
The ceiling did the opposite. It was flat and defended: 8.317 on August 22 on 1.91x the twenty-day average, and 8.341 on September 18 on 1.95x. Two touches, 2.4 cents apart. Between those two lines the market compressed for three weeks while the August 30 low of 7.011 gave way to a September floor that never traded below 7.169. Rising floor, unchanged ceiling, volume draining out of the middle: the geometry of accumulation, not distribution.
Advertisement
Friday cleared the last overhead print in the window
September 18 pushed 7.79% higher to close at 8.204 on 1.95x — the first close above 8.20 in the whole window. September 19 then opened at 8.204, never traded below 8.202, and closed at 10.094: a 23.04% session on 9,234,917 AVAX, 3.07x the twenty-day average and the heaviest single print anywhere in these 120 sessions. For context, the BTC daily structure map shows how differently the majors are behaving at the same moment.
That session did two things at once. It broke the August ceiling, and it cleared the May 25 high of 9.506 — the only overhead print left above the base, left behind when AVAX fell from 9.5 to the June 19 capitulation low of 5.681 on 7.91 million tokens. One candle erased the entire May–June decline, and today extended it to a fresh 120-day high at 10.825.
Advertisement
Today's candle is the first digestion test
Today opened at 10.093, tagged 10.825 — a new 120-day high — traded back to 9.436 and closed near 9.794. That is a 14.18% range against a twenty-day average of 5.8%, and it leaves the close 0.070 above the 0.786 retracement of the entire 5.681 to 10.825 advance at 9.724.
Nothing about that candle is alarming after a 34% three-session expansion. What matters is where the market stopped: 9.436 is -4.5% above the 0.382 retracement of the breakout leg at 9.876, and the session is holding well above the 0.618 of the June advance at 8.860. So far this is digestion, not distribution — but the volume pace matters more than the price here, because a vertical move that stops attracting volume is a move that is finished.
What has to hold
The first shelf is the 9.436 low of today’s candle. Under it, the retracement ladder of the 8.341 to 10.825 leg gives 9.583 (0.5), 9.290 (0.618) and 8.873 (0.786). The 0.786 is the number that matters, because the 0.618 retracement of the whole June advance computes to 8.860 — two different measurements of the same market landing about a cent apart. That is where Friday’s candle body began, and it is the level a real pullback should respect.
Underneath all of it sits 8.341 itself: the old ceiling, now the line that separates a breakout from an exhaustion spike. It is also the level that has to survive if the base is to keep reading as support — the same shape LTC cleared with its four-touch ceiling in a less extended form.
The two paths
Bull case: the base’s measured objectives are already paid. The 7.169 to 8.341 width of $1.172 projects 9.513, and its 1.618 extension lands at 10.237 — both printed inside Friday’s range. The next rung is the 2.618 extension at 11.409, and the spike leg’s own measure (9.436 + $2.484) lands at 11.920. Above 10.825 nothing has ever traded inside these 120 sessions, so the 11.40–11.90 band and the round 11.50 are the only references left. The path of least resistance stays upward while 9.436 holds on a closing basis; two or three sessions that rebuild volume above 9.60 put the 120-day high straight back in play, the way SOL reclaimed its own broken floor this month.
Bear case: it does not need a crash, only acceptance. A close under the digestion low opens the 0.618 retracement and then the 8.86–8.87 confluence, and losing that turns the three-session expansion into a failed spike rather than a trend. 8.341 is the invalidation line: below it the market is simply back in the base it spent four weeks building, and there is very little between that shelf and the 7.13–7.22 floor, because the whole third week of September traded in a vacuum. Probabilities are not certainty here — a 72% four-month advance is a lot to defend.
A 34% three-session expansion is an event, not a trend. Events get digested while the first higher low holds, and they fail the moment price is accepted back inside the structure it just left.
Written by
EarnCrypto.dev Editorial
The EarnCrypto.dev editorial team researches and reviews AI mining platforms, pools and earning tools — publishing only what passes our own checks.
Related reading

SOL Daily Analysis — Three Touches Under the $120.00 Round Number: The 114.29 Retrace Decides 126.56 or 105.05
Solana has been rejected at the $120.00 round number three sessions in a row after a 25% week. The $114.29 retrace decides whether 126.56 or 105.05 comes next.

BTC Daily Analysis — The 82,300 Box Broke: The 87,396 Double Touch Decides 90,776 or 82,648
Bitcoin broke its five-week $82,300 box on 21 September and has coiled under $87,396 since. The $84,463 retrace decides whether 90,776 or 82,648 comes next.

BNB Daily Analysis — The $780.64 Ceiling Broke: The 782.98 Retrace Decides 858 or 741
BNB cleared the $780.64 ceiling that had held since September 5 and reversed to 782.75 today, two ticks off the 782.98 retracement. The measured move is 858.