
LTC Daily Analysis — A 26.5% Slide Stopped 1.02 Above the 0.618 and Four Sessions Coiled Under 57.57: 59.79 or 54.07
LTC fell 26.5% to 55.09, stopped 1.02 above the 0.618 and has coiled four sessions. A close over 57.57 opens 59.79; under 55.09 the fib at 54.07 is next.
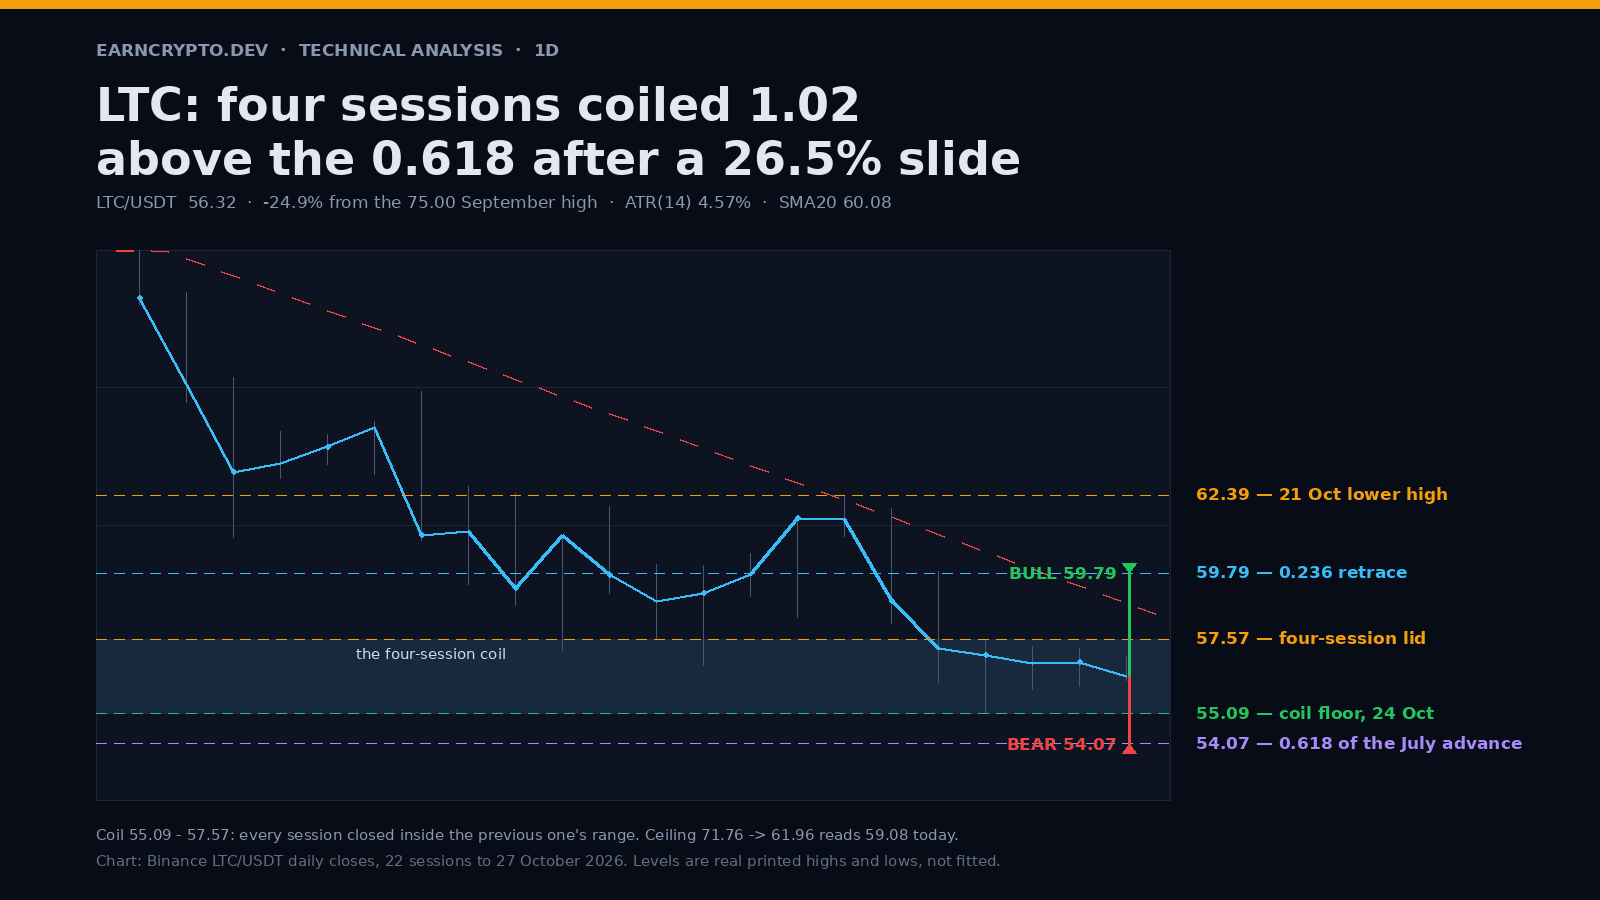
A 26.5% slide that stopped on the 0.618
Litecoin put in a twin top on 24 and 26 September, 74.86 then 75.00, sixteen cents apart, the shape we flagged on 6 October, and has been discounting it ever since. The 24 October low at 55.09 completes a 19.91-point give-back, 26.5% from the high. Spot is 56.35 at the time of writing, 24.9% under the top.
Where that low stopped is the whole story. The July to September advance ran from 41.14 on 1 July to 75.00, 33.86 points, and the 0.618 retrace of it sits at 54.074. The 24 October low printed 55.09, 1.02 above the fib, and then closed the session at 57.05, back inside the range. A corrective leg that stops a point above a 61.8% and reverses is the most common way these declines end.
Advertisement
It is also the second time this month a fib has decided a turn here. The 20 October note set the 0.5 at 57.14 as the shelf. Price closed 61.58 on 21 October, 58.87 the next session, then 55.09. The 0.5 broke and the 0.618 held.
Four sessions inside 24 October's range
Since then the market has coiled. The 24 October session traded 55.09 to 57.57 and each of the three sessions after it closed inside that range. Highs: 57.57, 57.34, 57.28, 57.00. Lows: 55.09, 55.90, 56.01, 56.19. The band is 2.48 points, 4.50% wide.
Advertisement
Inside the coil the lows have risen 1.10 points across three sessions while the highs have fallen 0.57. That is a contracting wedge sitting directly on top of the 0.618, and volume has faded with it: 0.83x, then 0.50x, then 0.70x of each session's own trailing average, with today at a 0.11x pace on a partial session.
The bull case: 57.57 and the 0.236 at 59.79
A close above 57.57 opens the 0.236 retrace at 59.789. The descending ceiling from 71.76 on 5 October through 61.96 on 21 October reads 59.078 today, so the two arrive in the same place within a week. That confluence is why 59.79 is the target and not a hope: the rail and the fib are converging on the same print.
Above it, the 0.382 sits at 62.696 and the 21 October high at 62.39 is the swing that has to go first. A close over 62.70 takes out the 21 October high and puts 65.045, the 0.5, on the map.
I give this side roughly 45%. The 0.618 hold, the rising lows and the volume fade all lean that way, but a 4.50% coil under a falling 20-day average at 60.08 is not a trend change yet.
The bear case: 55.09, then 54.07
A close under 55.09 puts the 0.618 at 54.074 back in play the same session. The 18 September low at 53.90 sits 0.17 below it, so a break of one is an immediate test of the other, and those two together are the last shelf before the 51.55 to 50.20 zone that held in mid-September.
Measured: the coil is 2.48 points. Projected lower from 55.09 that gives 52.61, within 0.32 of the 52.93 that the 20 October note carried as its bear objective. If 53.90 goes, 52.6 to 52.9 is the next honest stop, 6.6% below spot.
What invalidates both
Bull invalidation is a close back under 55.09 after a break of 57.57: that turns the coil into a bear flag and the 0.618 into a pause rather than a floor.
Bear invalidation is two consecutive closes above 57.57, or one above 59.79. The second one matters more, because it takes out the 0.236 and the descending rail in the same move.
Until the band resolves, the middle of the coil is the worst place on this chart to hold a position. At 4.50% wide against a 2.574 ATR, 4.57% of price, the band is barely one average daily range, which is exactly the kind of box that stops out both sides before it picks one.
The 0.618 held by 1.02 and the market has spent four sessions deciding whether that was luck or the end of the correction.
Written by
EarnCrypto.dev Editorial
The EarnCrypto.dev editorial team researches and reviews AI mining platforms, pools and earning tools — publishing only what passes our own checks.
Related reading
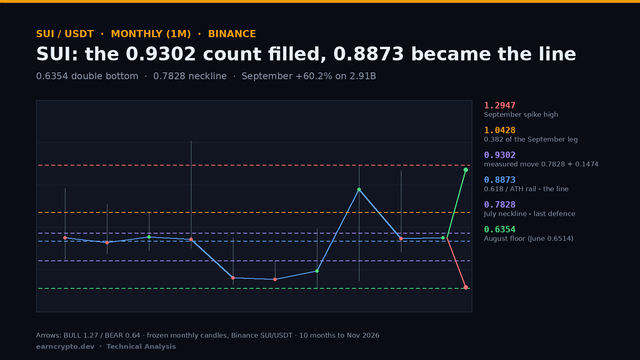
SUI Monthly Analysis — A 0.6354 Double Bottom Filled Its 0.9302 Count: The 0.8873 Retrace Decides 1.0428 or 0.7828
SUI filled the 0.9302 count of its 0.6354 double bottom at September's high and gave 22.8% back in October. The 0.8873 retrace now decides 1.0428 or 0.7828.
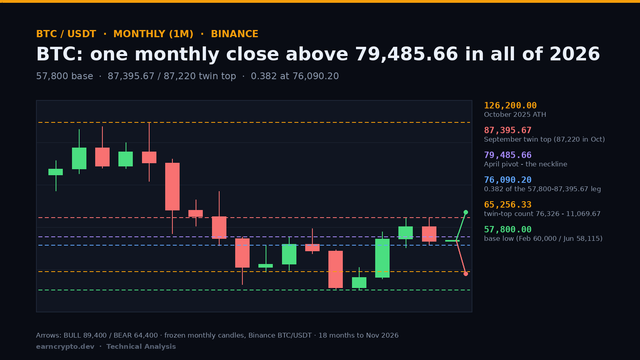
BTC Monthly Analysis — A Single 2026 Close Above 79,485.66 and an 87,395.67 Twin Top: 76,090 Decides 89,400 or 65,256
BTC closed October at 77,582, -7.2% under its open and back below the 79,485.66 pivot. The 76,090.20 retrace now decides whether 89,400 or 65,256 comes first.
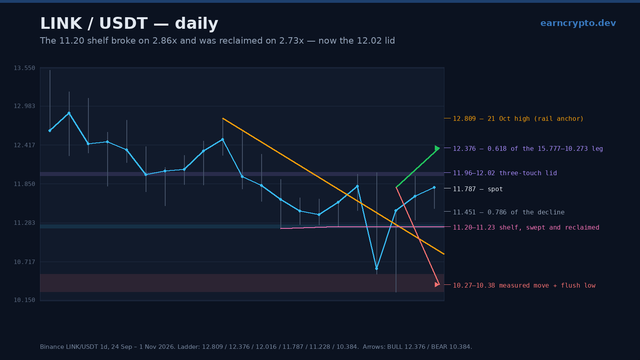
LINK Daily Analysis — The 11.20 Shelf Broke on 2.86x and Was Reclaimed on 2.73x: The 12.02 Lid Decides 12.38 or 10.38
Chainlink swept the 11.20 shelf on 2.86x volume, reversed the whole break on 2.73x and now fights a three-touch 11.96-12.02 lid. 12.02 decides 12.38 or 10.38.