
LTC Daily Analysis — A 24% Give-Back Stopped on the 0.5 at 57.14: The 61.35 Rail Decides 65.88 or 52.93
LTC's 24.4% give-back from the 75.00 top stopped on the 0.5 at 57.14 after three lower highs and three lower lows. No close has broken it. 61.35 decides.
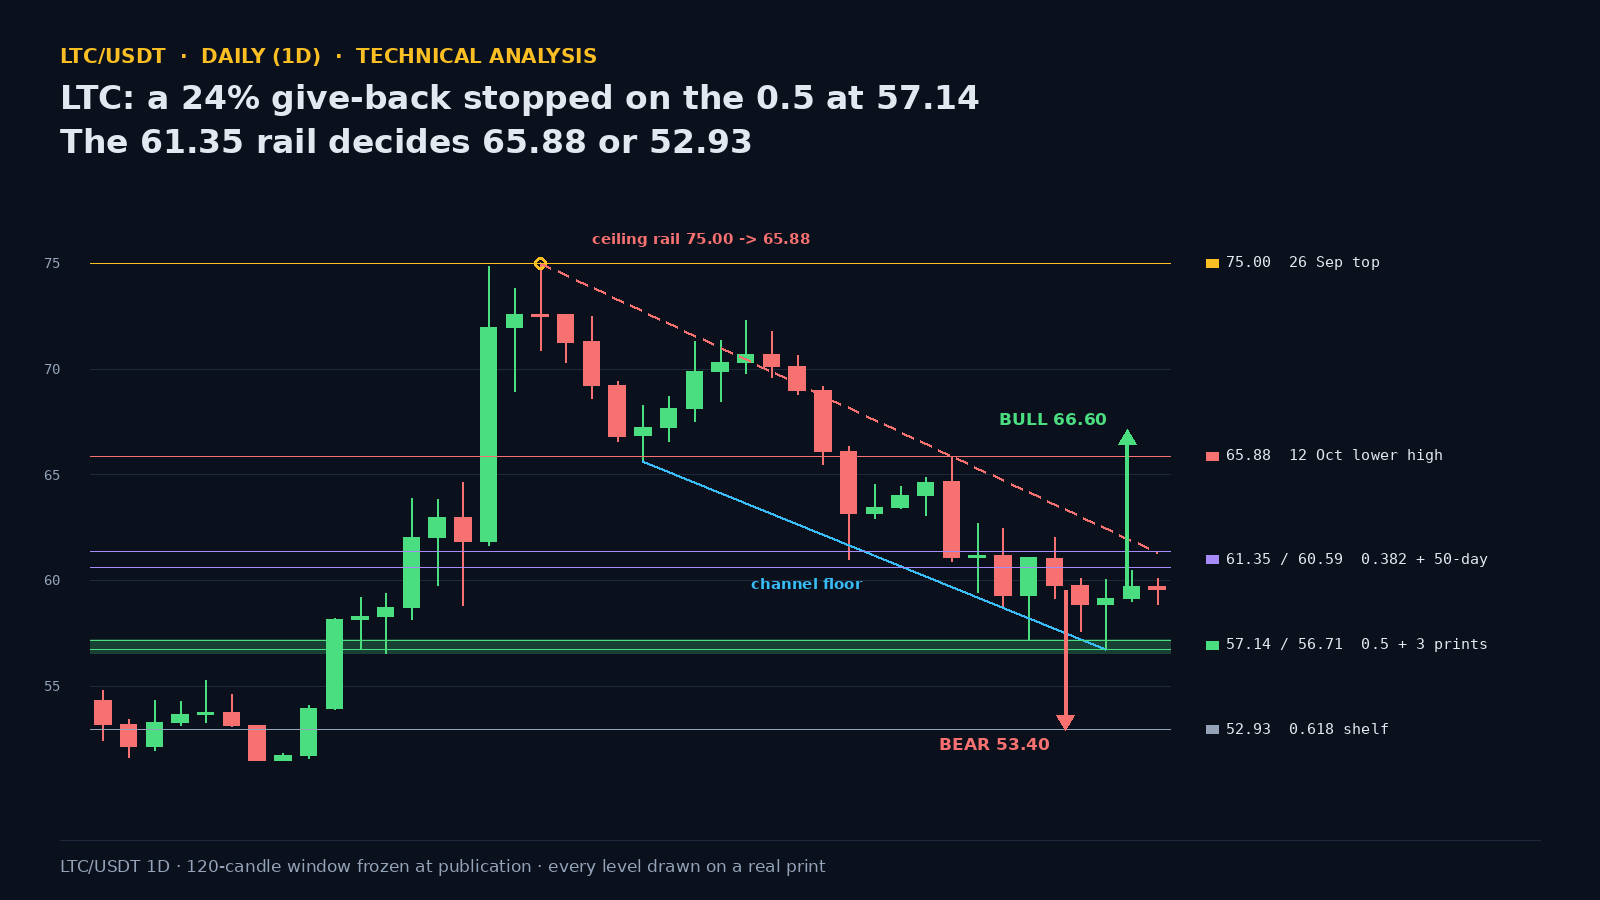
Litecoin closed 59.59 on 20 October after a 1.21-point session (58.86 to 60.07), on 48,920 LTC — a 0.15x pace against the twenty-day average of 330,841. That quiet candle is the twenty-fourth session of a give-back that has taken 20.5% off the 75.00 high of 26 September, and the fifth in a row to close under the fifty-day moving average. What matters is not the size of the decline — it is where it stopped.
Three Lower Highs, Three Lower Lows — a Wedge, Not a Crash
The ignition candle was 24 September: 61.85 opened, 71.95 closed, +16.35%, on 2,158,258 LTC, the heaviest session of the last thirty. Two sessions later the window high printed at 75.00, which is 90.9% above the 39.28 low of 25 June. Everything since has been a staircase with both rails falling: lower highs at 75.00 (26 September), 72.30 (4 October) and 65.88 (12 October); lower lows at 65.63 (30 September), 60.97 (8 October) and 56.71 (18 October). The ceiling sheds about 57 cents a session, the floor about 50 — converging, not parallel. That is a falling wedge, and today's 60.07 high is a fourth lower high in the making, printed under the fifty-day.
Advertisement
The 0.5 Held, and It Was Not the First Visit
18 October opened 58.84, wicked to 56.71 and closed at 59.12, +0.48%, on 298,646 LTC — 0.83x the twenty-day average. A sweep and a reclaim inside one session. The level it swept is older than the rally: 56.72 printed on 19 September and 56.53 on 20 September, three sessions before the ignition candle. Three prints inside a nineteen-cent band, and the 0.5 retracement of the whole 39.28 to 75.00 advance — 57.14 — lands in the middle of it. No daily close has printed below 57.14 since 17 September. The next shelf down is just as well documented: 52.99 on 25 August, 53.13 on 12 September and 53.09 on 14 September, with the 0.618 of the same leg at 52.93.
The Gate Is 60.59 to 61.35
Three separate measurements sit inside seventy-six cents. The ceiling rail measured from 75.00 and 65.88 projects 61.3 at today's index; the 0.382 retracement of the 39.28 to 75.00 leg is 61.35; the fifty-day moving average is 60.59, and 19 October's high stopped at 60.46 — thirteen cents short of it. A daily close above 61.35 ends the sequence of lower highs and opens 62.01, the high of 16 October, then 65.88, where the 30 September low at 65.63 was tested from both sides. The six-session base between 56.71 and 62.01 is 5.30 wide; a measured move above 62.01 projects 67.31, seventy-four cents from the 0.786 retracement at 66.57.
Advertisement
Indicators: Fourteen Closes Under the Twenty-Day, the Hundred-Day Intact
The last close above the twenty-day was 6 October, fourteen sessions ago. The fifty-day was lost on 16 October and has capped every close since. The hundred-day, at 53.61, has not been closed under at all — this correction is still inside the medium-term trend rather than a reversal of it. RSI(14) reads 42.1 after bottoming at 39.05 on this leg, the lowest reading since 30 June. ATR(14) is 2.90, or 4.87% of spot, and the last six sessions have travelled inside 8.89%. Volume is the tell the bears do not have: a 0.15x pace today is not capitulation, and the heaviest session of the last thirty is still the 24 September ignition candle.
The Trade: 61.35 Versus 56.71
Path of least resistance stays down while 61.35 caps the rallies. A rejection from the 60.46 to 61.35 band is the highest-probability reaction, and it sets up 58.86, then 57.20 (the low of 15 October), then a fourth test of the 56.53 to 57.14 shelf. A daily close under 56.53 opens 52.93, and the wedge's width where the rails converge — about 4.6 points — projects 52.1, eighty-three cents from the 0.618. The bull path needs work, not hope: reclaim 60.59, hold a retest of 60.00, then take 61.35. Invalidation is clean on both sides — a daily close above 65.88 kills the lower-high sequence, a daily close below 56.53 kills the shelf. Lean: roughly 55/45 to the downside while the rail caps price. This is a wedge that has not picked its side.
A 24% give-back that produced three lower highs, three lower lows and not one close under the 0.5 is not a crash — it is compression. Compression resolves from the edge, and the edges here are 61.35 and 56.53.
Data: LTC/USDT daily candles on Binance, Litecoin on CoinGecko, the LTCUSDT chart on TradingView.
Written by
EarnCrypto.dev Editorial
The EarnCrypto.dev editorial team researches and reviews AI mining platforms, pools and earning tools — publishing only what passes our own checks.
Related reading
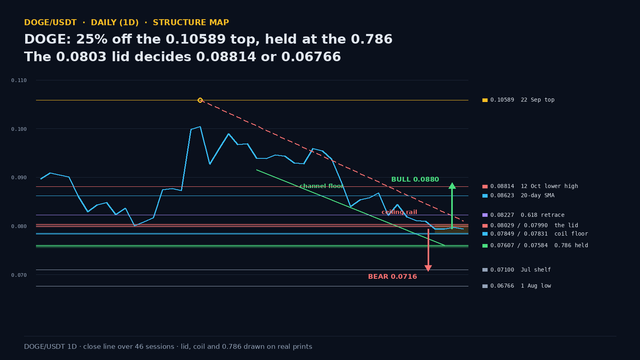
DOGE Daily Analysis — 25% Off the 0.10589 Top Held at the 0.786: The 0.0803 Lid Decides 0.08814 or 0.06766
DOGE is 25% under its 22 September top and has coiled for three sessions at 0.0800 with the 0.786 at 0.07584 intact. The 0.0803 lid decides 0.08814 or 0.06766.
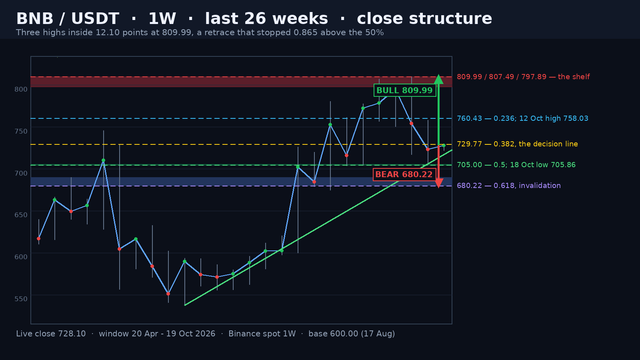
BNB Weekly Analysis — Three Highs Inside 12.10 Points at 809.99 and a Retrace That Stopped 0.865 Above the 50%: The 729.77 Line Decides 809.99 or 680.22
BNB weekly: three highs inside 12.10 points at 809.99, then a two-week retrace that stopped 0.865 above the 50%. The 729.77 line decides 809.99 or 680.22.
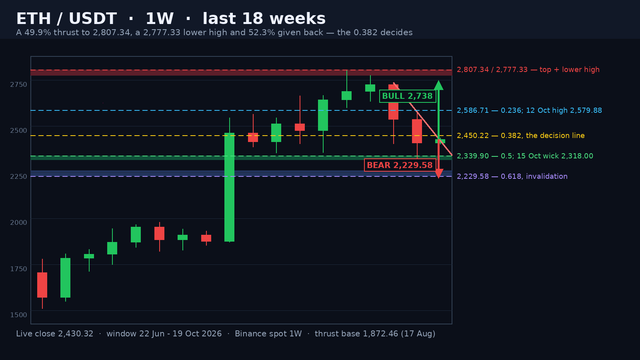
ETH Weekly Analysis — A 2,807.34 Top and a 2,777.33 Lower High Give Back 52.3% of the August Thrust: The 2,450.22 Line Decides 2,807 or 2,229
ETH weekly: a 2,807.34 top and a 2,777.33 lower high gave back 52.3% of the 934.88-point August thrust. The 2,450.22 line reopens 2,807; 2,318 opens 2,229.58.