
ETH Weekly Analysis — A 2,807.34 Top and a 2,777.33 Lower High Give Back 52.3% of the August Thrust: The 2,450.22 Line Decides 2,807 or 2,229
ETH weekly: a 2,807.34 top and a 2,777.33 lower high gave back 52.3% of the 934.88-point August thrust. The 2,450.22 line reopens 2,807; 2,318 opens 2,229.58.
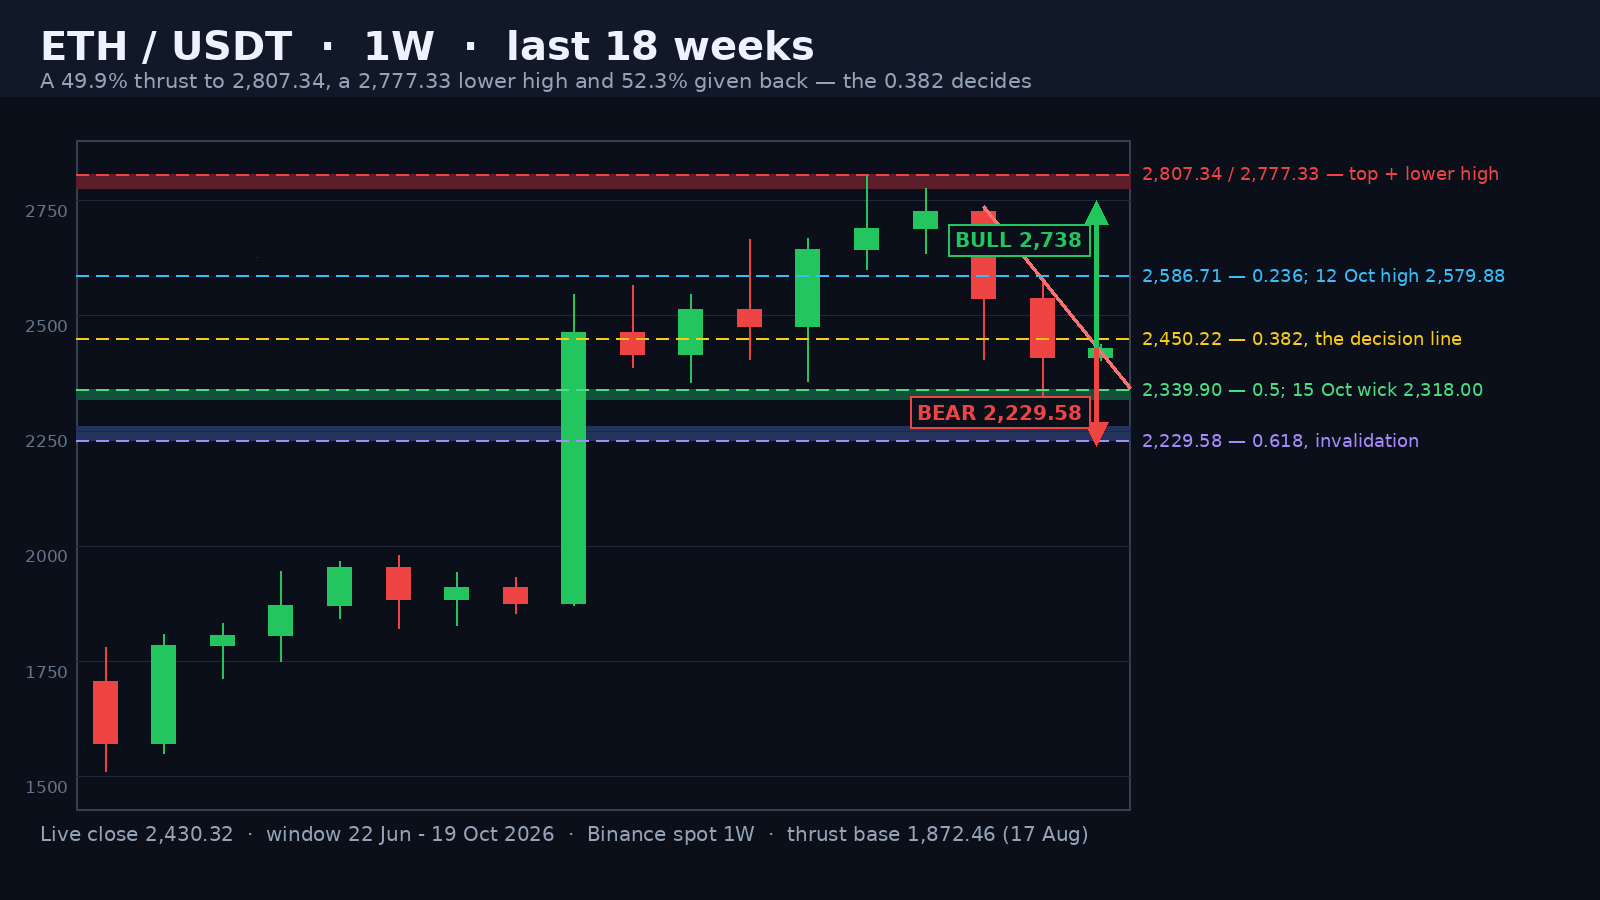
Ethereum printed the biggest weekly expansion of 2026 in the week of 17 August: a 1,872.46 low, a 2,546.78 high and a close at 2,463.41, on 3.37 million ETH — 1.77 times the twenty-week average. That candle started a 934.88-point advance that ended five weeks later at 2,807.34. Since then the market has handed back 489.34 points of it, which is 52.3%.
The Top Was Built on Average Volume
The detail that matters about 2,807.34 is the candle that made it. The 21 September week printed the high and then closed at 2,688.65 — 118.69 points, 4.23%, under it — on 1.95 million ETH. That is 1.02 times the twenty-week average. A blow-off top arrives on volume that dwarfs everything around it, and this one did not. Ethereum was not carried out on a spike; it rolled over on ordinary size.
Advertisement
Three Highs, Each on Less Fuel
The 14 September week put in 2,668.00 on 2.27 million ETH, 1.19 times average. The 21 September week put in 2,807.34 on 1.95 million, 1.02 times. The 28 September week came back to 2,777.33 — 30.01 points, 1.07%, under the peak — on 1.74 million, 0.91 times, and closed 2,726.94 after trading down to 2,635.69. Three successive weekly highs, and the volume fell at every step. That is the same shape Bitcoin printed three times in September, and it resolved the same way.
Two Red Weeks and 52.3% Given Back
Then the bid left. The week of 5 October opened 2,726.93, tagged 2,738.00 and closed 2,536.94 — down 6.97%. The week of 12 October opened at that close, tagged 2,579.88 and finished at 2,410.31 — down 4.99%. Together that is 489.34 points, 52.3% of the entire advance, and neither week carried more than 0.99 times the twenty-week average volume. Declining volume on a 12% decline is not capitulation. It is an offered market with no bid underneath it.
Advertisement
The 0.236 Was Missed by 6.83 Points
The first retracement of the advance sits at 2,586.71. The 12 October week high stopped at 2,579.88 — 6.83 points, 0.26%, short — and the week closed 176.40 points under the level it had just failed to reach. When a level derived from a 934.88-point range is missed by less than three-tenths of a percent, it is being used as a ceiling. The same thing happened on BTC in October at its own 0.236, and the market went on to fill the measured move.
The 15 October Wick Went Under the 50%
The daily candle on 15 October is the tell for the near term. It opened 2,421.61, traded down to 2,318.00 — 21.90 points through the 0.5 at 2,339.90 — on 446,113 ETH, the heaviest daily print of the whole correction, and closed at 2,442.08. That close is 5.35% above the low. The level was swept and the session was bought back; the three sessions after it closed 2,423.54, 2,402.82 and 2,410.31, every one of them above the sweep.
A 49.9% advance, three highs on falling volume, then two red weeks that gave back 52.3% of it. Ethereum has not broken anything yet — it has retraced to exactly the place where a retracement has to decide whether it was a correction or a distribution.
Where the Decision Is
The 0.382 at 2,450.22 is 19.90 points above the current 2,430.32, and it is the line. A weekly close above it does not open the sky; it opens the ladder of supply that the decline left behind. 2,586.71 is the 0.236 that already rejected once. 2,665.99 and 2,668.00 are the two September highs, a week apart and 2.01 points apart. 2,738.00 to 2,739.50 is the shelf from which the market broke, printed on the 4-5 October daily candles. Above it, 2,777.33 and 2,807.34 — and only a weekly close above 2,807.34 cancels the distribution outright.
The two-week ceiling drawn through 2,738.00 and 2,579.88 projects 2,421.76 onto the current candle, and price is 8.56 points above that projection. Two prints make a slope rather than a wall, so I am not calling it resistance. But it is the first time since the top that the market has closed above the rail connecting the last two highs, and it is the first evidence that the chain of lower highs is flattening instead of accelerating.
The Bear Case Is Arithmetic, Not Opinion
Below 2,450.22 the downside is short and well marked. 2,339.90 is the 50% that has already been swept. 2,318.00 is the 15 October low and the only print in the last eight weeks below 2,340. A weekly close under 2,318.00 opens the 0.618 at 2,229.58 with a 3.8% gap and no weekly close inside it — the market would travel through air. Under 2,229.58, the 0.786 at 2,072.52 and the 2,091.48 May 2026 low sit within 19 points of each other, and a weekly close under 2,072.52 breaks the entire August advance and puts the 1,872.46 base back on the map.
The Bull Case Needs 2,450.22 First
The bulls get 2,450.22 back, then have to deal with 2,586.71 — a level that has already rejected once, with a 0.26% miss. Above it the 2,665.99-2,668.00 twin high is the gate, then the 2,738.00 shelf. There is no measured-move target on the upside because this is a retracement, not a base: the honest count is a return to the 2,777.33-2,807.34 shelf, and that is 14.3% to 15.5% away. Anything that gets there in fewer than twelve weeks would be a different market from this one.
I would give the bears the edge at roughly 60/40 until 2,450.22 is closed above. The pattern is 52.3% delivered, the volume on the way down is flat rather than expanding, and the 15 October sweep left a 5.35% rejection wick — that is how a retracement ends, and it argues for a bounce first. What argues against the bulls is the thing that started all of this: three weekly highs, each on less volume than the last, into a top that was never confirmed by a volume expansion. Distribution resolves where the sellers want it, and the sellers have not been tested since 21 September.
Written by
EarnCrypto.dev Editorial
The EarnCrypto.dev editorial team researches and reviews AI mining platforms, pools and earning tools — publishing only what passes our own checks.
Related reading
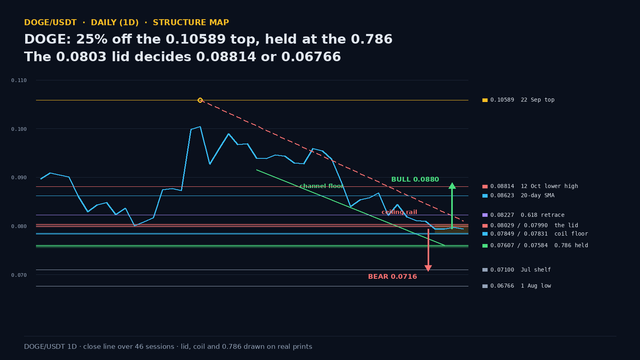
DOGE Daily Analysis — 25% Off the 0.10589 Top Held at the 0.786: The 0.0803 Lid Decides 0.08814 or 0.06766
DOGE is 25% under its 22 September top and has coiled for three sessions at 0.0800 with the 0.786 at 0.07584 intact. The 0.0803 lid decides 0.08814 or 0.06766.
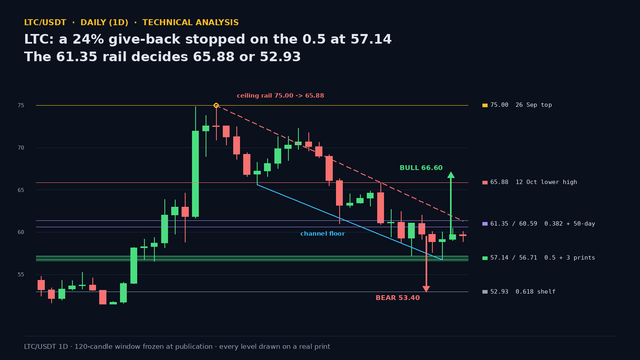
LTC Daily Analysis — A 24% Give-Back Stopped on the 0.5 at 57.14: The 61.35 Rail Decides 65.88 or 52.93
LTC's 24.4% give-back from the 75.00 top stopped on the 0.5 at 57.14 after three lower highs and three lower lows. No close has broken it. 61.35 decides.
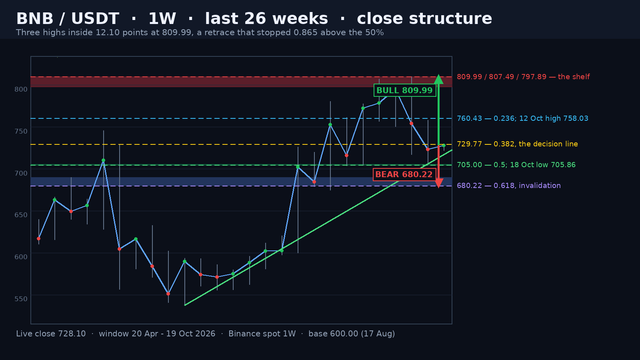
BNB Weekly Analysis — Three Highs Inside 12.10 Points at 809.99 and a Retrace That Stopped 0.865 Above the 50%: The 729.77 Line Decides 809.99 or 680.22
BNB weekly: three highs inside 12.10 points at 809.99, then a two-week retrace that stopped 0.865 above the 50%. The 729.77 line decides 809.99 or 680.22.