
BNB Weekly Analysis — Three Highs Inside 12.10 Points at 809.99 and a Retrace That Stopped 0.865 Above the 50%: The 729.77 Line Decides 809.99 or 680.22
BNB weekly: three highs inside 12.10 points at 809.99, then a two-week retrace that stopped 0.865 above the 50%. The 729.77 line decides 809.99 or 680.22.
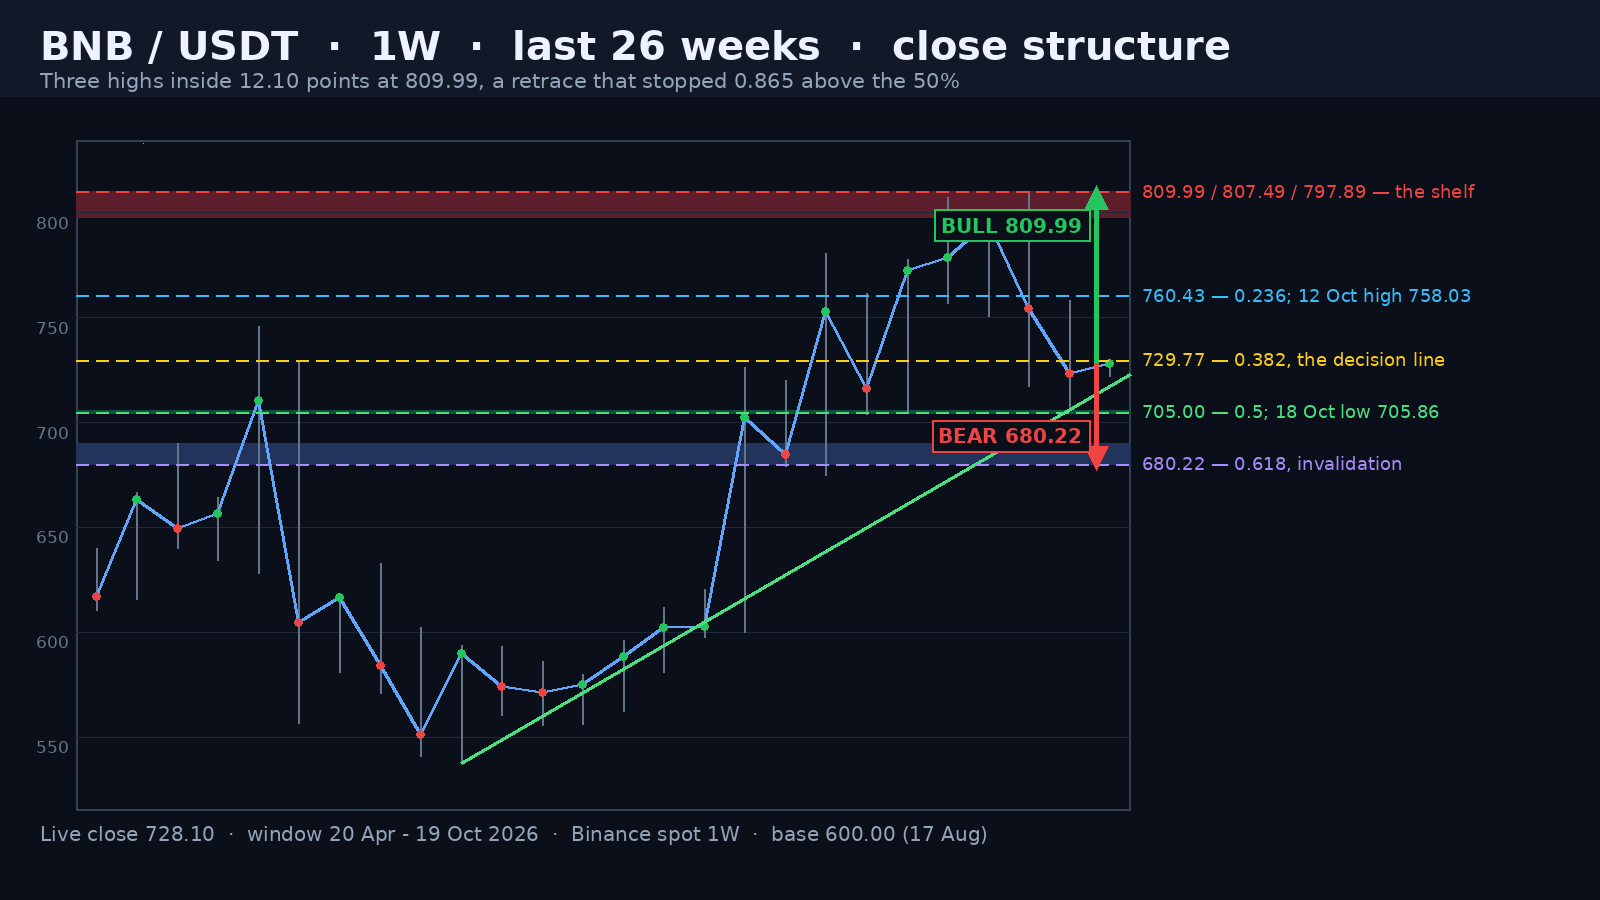
BNB broke out of a six-month base in the week of 17 August: a 600.00 low, a 726.08 high and a close at 702.37, on 1.57 million BNB — 1.74 times the twenty-week average. Seven weeks later it printed 809.99. That is a 35.0% advance, 209.99 points, and two red weeks have now given back 104.13 of them, or 49.6%.
The Top Is a Shelf, Not a Spike
The 21 September week printed 807.49 and closed 778.90. The 28 September week printed 797.89 and closed 795.43. The 5 October week printed 809.99 — the high of the move — and closed 754.24, which is 5.18% under it, on 0.82 times the twenty-week average. Three weekly highs inside 12.10 points, 1.5% of price, and the last one was made in the same week the structure broke. That is what distribution looks like on a weekly chart: the highs stop making progress while the closes deteriorate underneath them.
Advertisement
The Retrace Stopped 0.865 Above the 50%
The two red weeks were -5.18% and -4.09%, on 0.82x and 0.77x the twenty-week average — the two lightest weeks of the entire advance. The week of 12 October opened 754.24, tagged 758.03 — 2.40 points under the 0.236 at 760.43 — and then bled all the way to 705.86 on Sunday 18 October before closing at 723.36.
That low finished 0.865 points above the exact 50% retrace of the 600.00-809.99 advance, which is 704.995. Not eight points above it, not twenty: eight hundred and sixty-five thousandths of a dollar. The session that printed it traded 76,300 BNB — 0.40x the 190,164 that changed hands when the shelf broke on 8 October — and it closed 2.48% above its own low. Levels are swept on size. This one was visited on almost none and bought straight back.
Advertisement
The Rising Base Underneath
The base that produced the move is still intact underneath. Through June and July the weekly lows were 537.25, 555.59, 562.03, 581.03, 597.32 and 600.00 — six higher lows into the breakout. Since then the market has held a rising floor of 674.60, then 703.62, then 704.29, and even after the top the deepest pullback low is 705.86, which is above all three. That is seven weeks of defended ground at 674-706, and the 18 October low sits at the top edge of it rather than through it.
The Neckline Nobody Closed Under
The 8 October daily low is 717.07 — the break level of the shelf and the start of any count taken from it. 809.99 minus 717.07 is 92.92 points, which projects 624.15, or 14.3% below the current price. Price has traded under that level exactly once, at 705.86 on 18 October. The week closed at 723.36, 6.29 points above it. Until a weekly close prints beneath 717.07, the measured move has not started, and a count that has not started is not a target.
Three highs inside 1.5% of each other, then two light red weeks that stopped 0.865 above the 50% and closed back above the neckline. This is a bull flag until the market proves otherwise — but the shelf above is real, and it took seven weeks to build.
The Line That Decides It
The 0.382 at 729.77 is 1.67 points above today's close of 728.10. That is the whole argument in one number. Above it the pullback is a flag inside an advance; below it the market is back inside the retrace with 705.00 and 717.07 to deal with.
The Bull Case
A weekly close above 729.77 makes 760.43 the first target, and the zone is 758-760 rather than a line — the 12 October high of 758.03 died 2.40 points under the 0.236. Above 760.43 the market is retracing its own pullback, and the next real supply is the shelf at 797.89-809.99: a 12.10-point band that has rejected three times in three weeks. A weekly close above 809.99 is the only thing that ends the distribution, and it would leave the entire shelf as support underneath. Between 760.43 and 797.89 there is nothing but the September closes at 778.90 and 795.43 — nine weeks of chop for anyone trying to trade the middle.
The Bear Case
Below 729.77 the market is inside the retrace, and 717.07 is the neckline. Under it, 704.995 and the 18 October low at 705.86 are one zone — a 0.865-point band, which is not a place to put a stop. A weekly close under 705.00 opens the 0.618 at 680.22, 6.6% below today's price and the level where the 2026 base rail from 537.25 converges with the fib. Under 680.22 the shelf count at 624.15 is the target and the rising base of the entire advance is what gets tested.
I would give the bulls a narrow edge here, around 55/45, for three reasons that are all visible in the data rather than in the narrative: the pullback came on 0.82x and 0.77x volume, the worst print of it stopped 0.865 points above the exact 50%, and every low since 31 August has held above 674.60. What keeps it from being a stronger call is the top itself — three weekly highs inside 1.5% with a -5.18% close on the last one is distribution, and distribution shelves do not disappear because the retrace was polite.
The invalidation is clean on both sides. A weekly close above 809.99 ends the bear case entirely; a weekly close under 705.00 ends the bull case and turns 680.22 into the next stop. Between 729.77 and 760.43 the market is deciding, and that is where the next weekly candle matters more than the last seven.
Written by
EarnCrypto.dev Editorial
The EarnCrypto.dev editorial team researches and reviews AI mining platforms, pools and earning tools — publishing only what passes our own checks.
Related reading
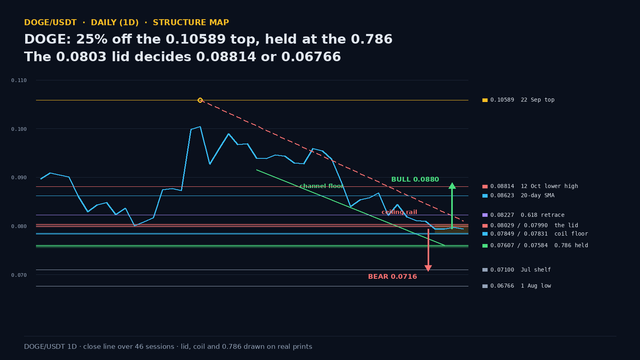
DOGE Daily Analysis — 25% Off the 0.10589 Top Held at the 0.786: The 0.0803 Lid Decides 0.08814 or 0.06766
DOGE is 25% under its 22 September top and has coiled for three sessions at 0.0800 with the 0.786 at 0.07584 intact. The 0.0803 lid decides 0.08814 or 0.06766.
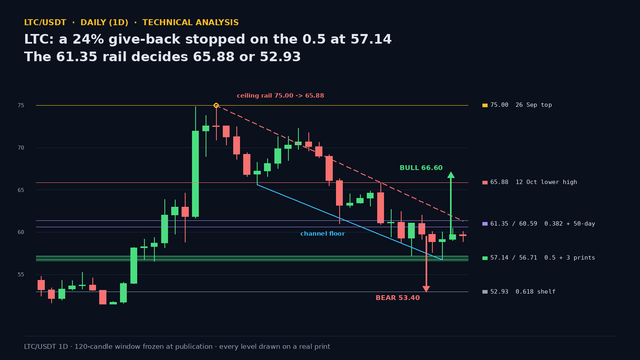
LTC Daily Analysis — A 24% Give-Back Stopped on the 0.5 at 57.14: The 61.35 Rail Decides 65.88 or 52.93
LTC's 24.4% give-back from the 75.00 top stopped on the 0.5 at 57.14 after three lower highs and three lower lows. No close has broken it. 61.35 decides.
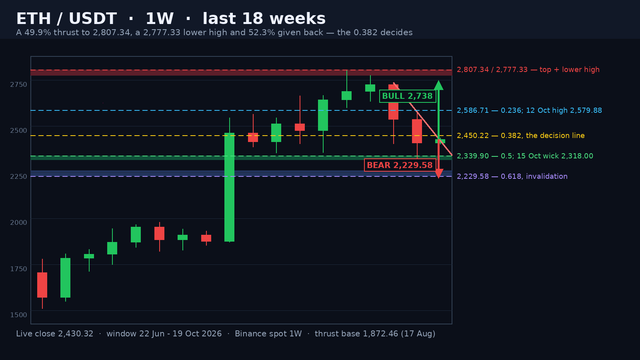
ETH Weekly Analysis — A 2,807.34 Top and a 2,777.33 Lower High Give Back 52.3% of the August Thrust: The 2,450.22 Line Decides 2,807 or 2,229
ETH weekly: a 2,807.34 top and a 2,777.33 lower high gave back 52.3% of the 934.88-point August thrust. The 2,450.22 line reopens 2,807; 2,318 opens 2,229.58.