
LTC Daily Analysis — The 75.00 Twin Top Left a 6.04-Point Count Only 55% Filled: A Rising Floor Cracks and 68.96 Decides 74.11 or 62.92
LTC's 75.00 twin top left its 6.04-point count 55% filled, the 68.96 neckline was reclaimed and the five-session rising floor cracked at 69.07. 74.11 or 62.92.
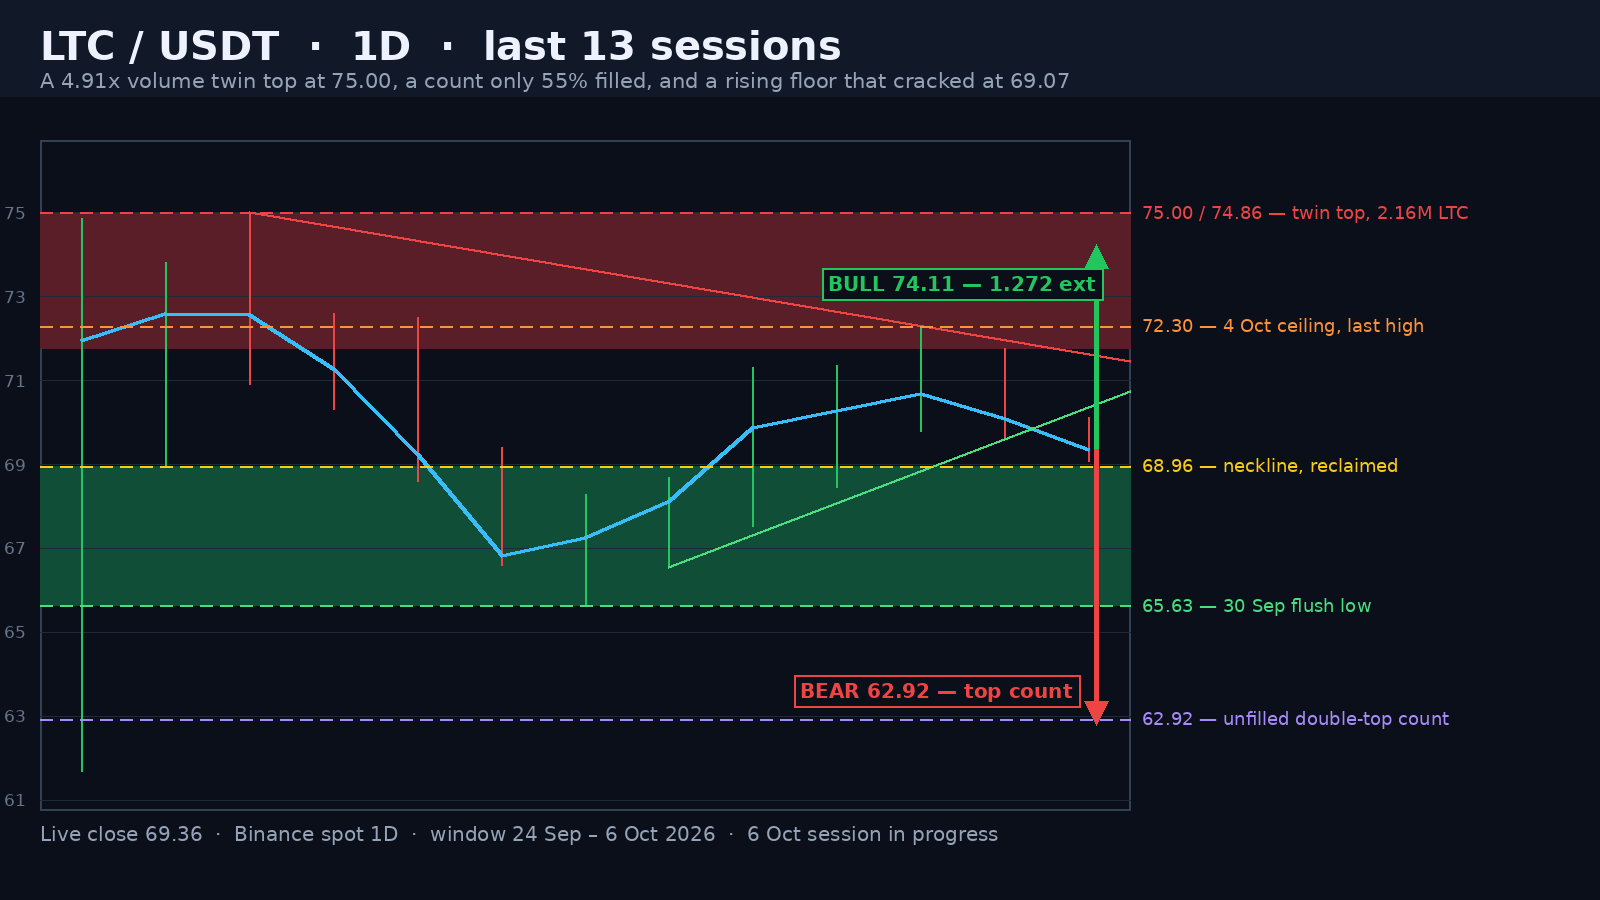
Litecoin is trading at 69.36 in the opening hours of the 6 October session, 7.5% under the 75.00 high of 26 September and 5.7% above the 65.63 low of 30 September. Today's range is 1.05, 1.51% of spot, on 65,563 LTC in the first seven hours — a pace of about 0.36x a normal full session against the 20-day average of 599,274, and on that trajectory the lightest day since 12 September. The number that matters is 68.96: the neckline of the double top, broken on 29 September, reclaimed on 1 October and defended by four closes since. Today's low of 69.07 stopped 0.11 above it.
A Twin Top Written by the Heaviest Tape of the Window
The 24 September session is where the structure starts: it opened 61.85, printed 74.86 — a 13.19-point range, 21.4% of the open — and closed 71.95 on 2,158,258 LTC, which is 4.91x the 20-day average of 439,724 and 2.55x the previous session. Two days later the market tried the same shelf again and printed 75.00, a 0.14 improvement, on 606,090 — less than a third of the first leg's tape. The heavier hand is the one that sold the second peak, and that is what makes this a double top rather than a breakout.
Advertisement
A 6.04-Point Count That Only 55% Filled
The two peaks sit 6.04 points above the 68.96 low of 25 September, which gives the pattern a measured move to 62.92. The break came on 29 and 30 September: the neckline gave way, then 67.25, then 65.63 — and there the selling stopped. 3.33 points filled of 6.04, 55% of the count, with buyers appearing 70.3% into a retracement of the entire 61.67-75.00 vertical. The 0.786 of that leg at 64.52 was never touched. That failure to finish the count is why the shelf still matters.
A Reclaimed Neckline and a Rising Floor That Just Cracked
What followed was more constructive than the breakdown implied. The 1 October session closed 68.12 back above the neckline, and the next four closes — 69.89, 70.29, 70.70, 70.10 — all held above it. Under them the lows lifted: 66.55, 67.51, 68.45, 69.79, 69.59, a rail of roughly 0.76 a session. Above them the highs tightened against a falling ceiling: 71.31, 71.36, 72.30, then 71.76 and 70.12 — the last two are consecutive lower highs. And the recovery has run on 360,807, 567,554, 416,782, 304,042 and 319,829 LTC against the 2.16 million of the spike candle. Today's low of 69.07 takes out yesterday's 69.59 by 0.52, the first break of that rising rail — the session's real signal.
Advertisement
What the ATR and the Convergence Say
Distance matters here. The ATR14 is 3.87 points, 5.58% of spot — this market travels 3.9 points on an ordinary day — so a 1.05 range with seven hours gone is a market that has not decided anything yet. RSI14 reads 64.2, the 20-day average at 66.31 sits under price and the 50-day at 57.26 is far below: trend intact, momentum cooling. Add that to the convergence — a floor at 68.96 to 69.07 against a falling ceiling already at 70.12 — and whichever gives first defines the next 5%.
The bull case is a daily close that keeps 68.96 and a reclaim of 71.36, the 2 and 3 October ceiling. That reopens 72.30, and above it the wedge geometry projects 74.11 — the 1.272 extension of the 65.63-72.30 leg — just under the 74.86 / 75.00 twins. A close above 75.00 extends the same leg to 76.42. The invalidation is exact: a daily close below 68.96 kills this path, because that is the neckline the whole structure was built on.
The bear case needs a close, not a wick. A daily close under 68.96 re-arms the unfilled 6.04-point count and its 62.92 target, with the 0.618 of the 61.67-75.00 vertical at 66.76 and the 30 September flush at 65.63 on the way — and 62.92 sits just above the 61.67 base of the leg, so the two bracket one shelf rather than two separate targets. Under 65.63 this stops being a failed breakdown and becomes a completed double top. A close back above 72.30 cancels the bear read entirely.
Written by
EarnCrypto.dev Editorial
The EarnCrypto.dev editorial team researches and reviews AI mining platforms, pools and earning tools — publishing only what passes our own checks.
Related reading

SOL Weekly Analysis — A 17-Week Doubling Topped Twice at 124.95 / 123.76: The 116.32 Neckline Decides 124.95 or 100.19
SOL doubled 107.8% in 17 weeks into a 124.95 / 123.76 two-touch top and paid its 108.29 count to 105.71. The 116.32 neckline decides 124.95 or 100.19.

AVAX Weekly Analysis — A 55.2% Thrust and Four 2x-Volume Weeks Under a 12.008 Two-Touch Top: The 10.866 Retrace Decides 14.25 or 8.387
AVAX ran a 55.2% week on 2.27x volume, then coiled four weeks under an 11.799 / 12.008 two-touch top. The 10.866 line decides 14.25 or the 8.387 count.

ETH Daily Analysis — A 2,392.96 Count 94% Filled and Five Rising Lows Back at the 0.382: The 2,635 Line Decides 2,777 or 2,406
ETH's 2,807/2,600 distribution left a 2,392.96 count that went 94% filled at 2,406.11. Five rising lows have retaken the 0.382 — 2,635 decides 2,777 or 2,406.