
LINK Daily Analysis — The 11.20 Shelf Broke on 2.86x and Was Reclaimed on 2.73x: The 12.02 Lid Decides 12.38 or 10.38
Chainlink swept the 11.20 shelf on 2.86x volume, reversed the whole break on 2.73x and now fights a three-touch 11.96-12.02 lid. 12.02 decides 12.38 or 10.38.
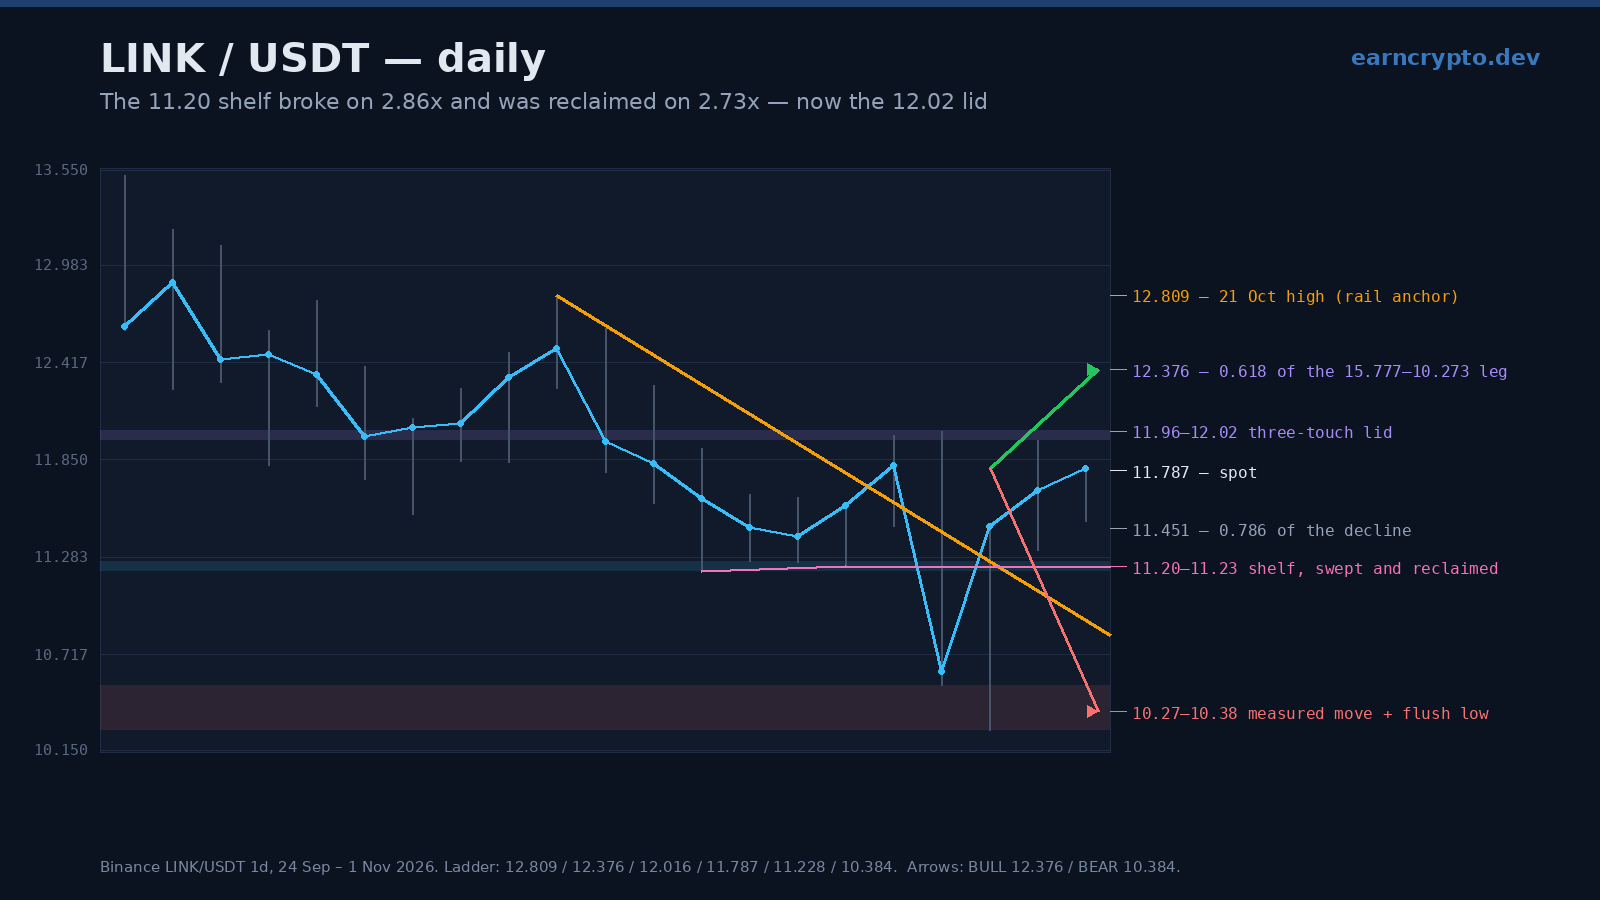
Chainlink closed at 11.800 after two sessions that did opposite things on almost identical volume: a 2.86x collapse through the shelf that had held for a week, then a 2.73x session that took the whole break back. That pair of candles is the most informative thing on this chart, and it is why the number to watch is now 12.02 rather than 11.20.
Our 27 October note put the decision at 11.629, with 12.95 above and 10.62 below. The market took the lower path, printed 10.540 on 29 October — eight cents past that target — and then reversed the entire move the next day. The bear case was right for exactly one session.
Advertisement
Three touches at 11.20, then a 10.2% break
The shelf is dated precisely. Lows of 11.200 on 24 October, 11.251 on 26 October and 11.228 on 27 October — three sessions inside a 0.051 band — with no close under 11.406. That was the floor under a market that had already given back 28.8% of the 29 September high.
29 October broke it hard. The session opened at 11.820, tagged 12.016 and then sold to 10.540 before settling at 10.620: a 1.476 range, 12.5% of the open, and a close 10.2% under it. Volume of 4.41 million was 2.86 times the twenty-session average — the heaviest print since 29 September's 5.50 million.
Advertisement
One 2.73x session took the whole break back
Friday answered. The session opened at 10.621, printed 10.273 — the deepest price of this entire decline — and closed at 11.465, 7.9% above its open and 70% of the way back through Thursday's body. Volume was 4.64 million, 2.73x normal, and heavier than the break itself.
Two things make that session more than a bounce. First, the close landed 0.237 above the shelf that had just failed, which turns a breakdown into a sweep. Second, the low of 10.273 undercut the 0.618 retracement of the July-September advance (7.522 to 15.777) — 10.675 — by 0.402 and reclaimed it on the same candle. A market that sweeps a 0.618 and closes back over it is usually done selling for a while.
Now the three-touch lid at 11.96-12.02
The recovery has run into a ceiling that is just as well documented as the floor was. Highs of 11.995 on 28 October, 12.016 on 29 October and 11.963 on 31 October sit inside a 0.053 band — three tests of the 12.00 round number in four sessions, none of them closed above 11.819.
Today's high of 11.807 poked 0.088 above the descending rail that has capped every bounce since 21 October's 12.809. That rail projected 11.719 for today, and this is the first session since it was drawn that has traded over it. A rail broken on a Sunday with 0.29x the normal volume is not confirmation — but it is the first evidence the sellers' staircase has stopped stepping.
What each side needs
Above, a daily close over 12.020 opens 12.376, the 0.618 retracement of the 15.777 to 10.273 decline, with 20 October's 12.475 sitting just above it and 12.809 beyond that. The 13.025 mid-line only comes into play on a close over 12.475. The 20-day sits at 11.914, 1.0% above spot, and reclaiming it would put the pair back inside the range it lost on 29 October.
Below, the shelf's own count is the cleanest number on the chart: 0.816 from the 12.016 high to the 11.200 floor, projected down from a failed retest gives 10.384 — 0.111 above Friday's low. A rejection at 12.02 that loses today's 11.492 would put 11.228 back in play first, and only a close under the shelf reopens that count.
A 2.86x break that is reversed on 2.73x is information: the sellers got their move and it did not hold. Until 12.02 is reclaimed the range is still 11.20-12.02, but the burden of proof has shifted to the downside.
The honest read is a range, not a trend. Between 11.228 and 12.016 the pair has 0.816 of room, which is 6.9% of spot against an ATR(14) of 0.653 — barely two sessions of average range. That favours a resolution soon, and the volume pattern tilts it up: the two heaviest sessions of the past three weeks are the break and its reversal, and the reversal was the heavier of the two — at the lowest price of the decline. A rejection at 12.02 that closes back under 11.492 would flip that read immediately, and then the 10.38 count is live.
Chart: LINK/USDT on Binance · Data: Chainlink on CoinGecko · Reference grid: BINANCE:LINKUSDT on TradingView. Every level is drawn on the frozen 120-session window.
Written by
EarnCrypto.dev Editorial
The EarnCrypto.dev editorial team researches and reviews AI mining platforms, pools and earning tools — publishing only what passes our own checks.
Related reading
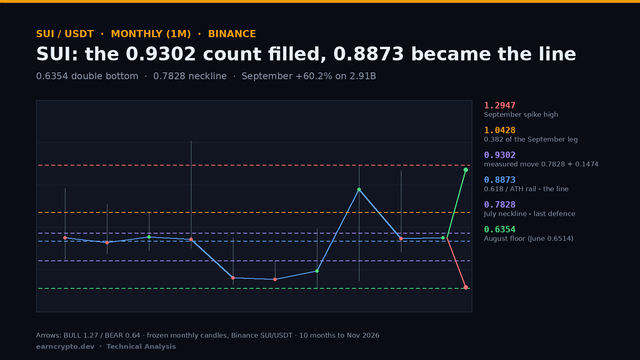
SUI Monthly Analysis — A 0.6354 Double Bottom Filled Its 0.9302 Count: The 0.8873 Retrace Decides 1.0428 or 0.7828
SUI filled the 0.9302 count of its 0.6354 double bottom at September's high and gave 22.8% back in October. The 0.8873 retrace now decides 1.0428 or 0.7828.
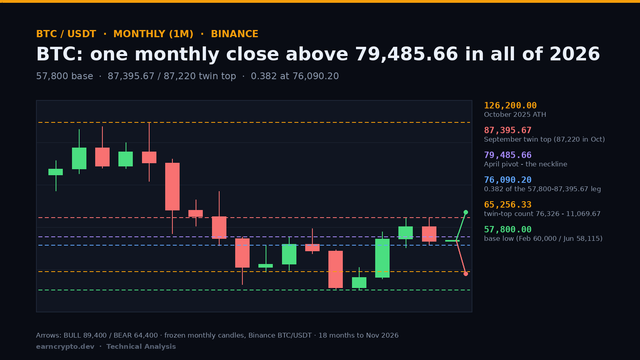
BTC Monthly Analysis — A Single 2026 Close Above 79,485.66 and an 87,395.67 Twin Top: 76,090 Decides 89,400 or 65,256
BTC closed October at 77,582, -7.2% under its open and back below the 79,485.66 pivot. The 76,090.20 retrace now decides whether 89,400 or 65,256 comes first.
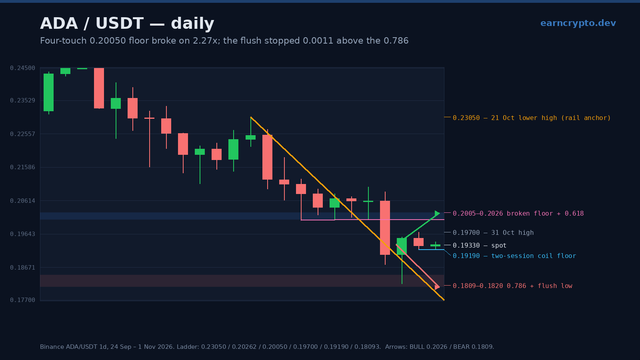
ADA Daily Analysis — A Four-Touch 0.20050 Floor Broke on 2.27x and the Flush Stopped 0.0011 Above the 0.786: 0.1919 Decides 0.2026 or 0.1809
Cardano's four-touch 0.20050 floor broke on 2.27x volume and the flush stopped 0.0011 above the 0.786. Three quiet sessions now decide 0.2026 or 0.1809.