
ADA Daily Analysis — A Four-Touch 0.20050 Floor Broke on 2.27x and the Flush Stopped 0.0011 Above the 0.786: 0.1919 Decides 0.2026 or 0.1809
Cardano's four-touch 0.20050 floor broke on 2.27x volume and the flush stopped 0.0011 above the 0.786. Three quiet sessions now decide 0.2026 or 0.1809.
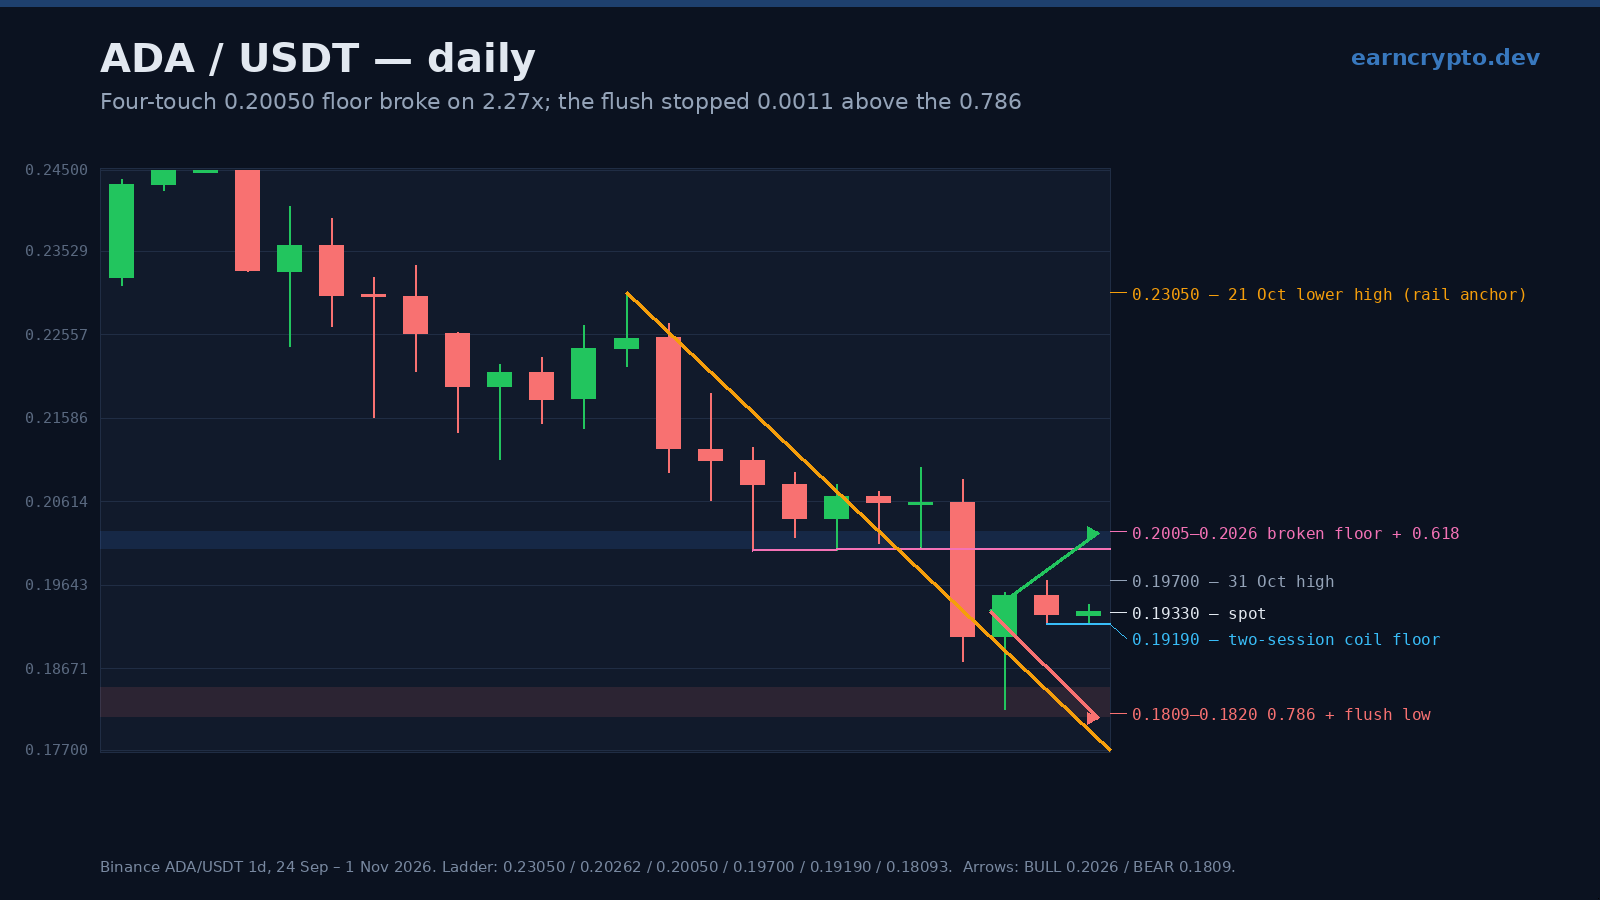
Cardano closed at 0.19340 on a Sunday session that has traded 0.19190 to 0.19420, three sessions after the floor that had held for a week finally gave way. The break is worth measuring precisely, because it went further than the tape suggested it would and then stopped almost exactly where the fibonacci grid of the July-October advance said it should.
The level that failed was not decorative. It was the 61.8% retracement of a 35.6% rally, defended four times in five sessions, and it took 2.27 times normal volume to break it. That is the kind of move that sets the tone for the next two weeks rather than one session.
Advertisement
Four touches at 0.20050, then 2.27x
Between 24 and 28 October the pair printed lows of 0.20050, 0.20050, 0.20130 and 0.20070 — four consecutive sessions inside a 0.00080 band, and no close below 0.20420. That is a shelf, not a line: buyers arrived at the same price four times and were paid for it.
On 29 October the shelf broke. The session opened at 0.20610, tagged 0.20870 and then sold to 0.18750 before settling at 0.19040 — a 0.02120 range, 10.3% of the open, on 201.9 million ADA. Volume was 2.27 times the average of the twenty sessions before it and the heaviest print since 8 October's 290.5 million. The close was 7.6% under the open.
Advertisement
The next session did not continue. Friday traded down to 0.18200, 0.01850 under the shelf, and then closed at 0.19520 — 2.5% above the previous close. A break that gets bought back that hard in one session is no longer a clean breakdown; it is a sweep of a level that a lot of stops were resting under.
The flush stopped 0.0011 above the 0.786
Where the low landed is the part that matters. The advance from the 28 July low of 0.15330 to the 6 October high of 0.28240 measures 0.12910, and its 0.786 retracement sits at 0.18093. Friday's flush missed that line by 0.00107.
The same grid explains the shelf. The 0.618 of that advance is 0.20262 — 0.00212 above the four-touch floor. The floor was the 61.8% retracement, tested until it broke, and the sell-off then ran a further 15.2% of the leg's length — in two sessions — to within 0.00107 of the 0.786.
Three closes since Friday sit in a 0.00220 band — 0.19520, 0.19300 and today's 0.19340 — under a floor that is no longer support. Volume has collapsed with the range: 31 October traded 32.3 million ADA (0.35x its twenty-day average) and today's partial session is running a 0.12x pace against 87.4 million. Today's range of 0.00230 is 1.19% of spot against an ATR(14) of 0.01019, or 5.27%.
The measured move filled, then overshot
Measured moves are the least romantic and most useful tool here. The shelf is 0.20050 to the 28 October high of 0.21010, which is 0.00960; projected down from the break that is 0.19090. Friday's 0.18200 went 0.00890 through it, so the count was filled and overshot on the very candle that stopped 0.0011 above the 0.786.
That matters for what comes next. A completed measured move is a market that has done what it said it would do, and the 30 October candle bought it back — so the sellers no longer have a nearby target, while the buyers have a 0.786 with a 0.00107 miss on it. What has not happened is a reclaim: the 20-day sits at 0.21282 and the 50-day at 0.22865, 10.0% and 18.2% above spot, and every close since 29 October has been under both.
What invalidates each side
Above, the bear case dies at 0.20050-0.20262: a daily close back inside that band would put price above both the broken floor and the 0.618 in the same session. The rungs above are 0.20870 (29 October's high) and then 0.21282, and a close over the 20-day would turn the 29 October candle into a sweep rather than a breakdown.
Below, the bull case dies at 0.19190 — the two-session low of 31 October (0.19200) and today. A close under it reopens 0.18610, then Friday's 0.18200 and the 0.786 at 0.18093. Under the 0.786 the only structure left inside this window is the July low at 0.15330, which is 26% away and not a trade anyone should be sizing from a daily chart.
Three closes inside 0.00220 under a floor that broke on 2.27x is compression, and compression resolves in the direction of the volume that created it. Until 0.20050 is reclaimed the path of least resistance is 0.18093, but the measured move is already behind the market.
So the bias is lower while the pair stays under 0.20050, but the shape favours a retest of 0.18200 over a straight collapse: Friday showed buyers under 0.18600, the 0.786 was missed by a tick and never revisited, and a market that has already completed its count and bounced off a 0.786 usually needs fresh news to extend. The scenario that would kill the bear read is not a wick over 0.20050 — it is a close over it on volume above 1.5x, which is what a genuine reclaim of a 2.27x breakdown looks like.
Chart: ADA/USDT on Binance · Data: Cardano on CoinGecko · Reference grid: BINANCE:ADAUSDT on TradingView. Levels are drawn on the frozen 120-session window; no level in this article is an estimate.
Written by
EarnCrypto.dev Editorial
The EarnCrypto.dev editorial team researches and reviews AI mining platforms, pools and earning tools — publishing only what passes our own checks.
Related reading
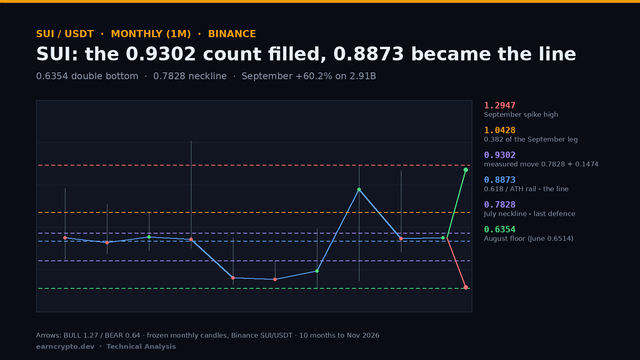
SUI Monthly Analysis — A 0.6354 Double Bottom Filled Its 0.9302 Count: The 0.8873 Retrace Decides 1.0428 or 0.7828
SUI filled the 0.9302 count of its 0.6354 double bottom at September's high and gave 22.8% back in October. The 0.8873 retrace now decides 1.0428 or 0.7828.
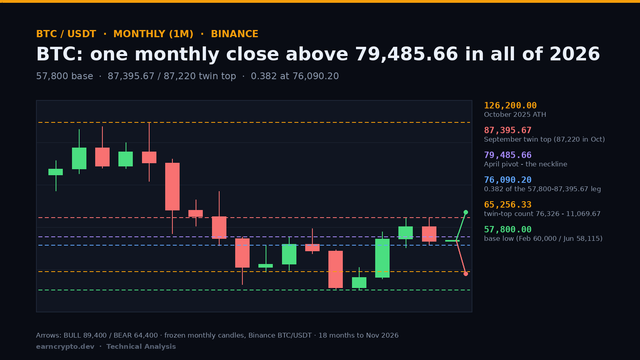
BTC Monthly Analysis — A Single 2026 Close Above 79,485.66 and an 87,395.67 Twin Top: 76,090 Decides 89,400 or 65,256
BTC closed October at 77,582, -7.2% under its open and back below the 79,485.66 pivot. The 76,090.20 retrace now decides whether 89,400 or 65,256 comes first.
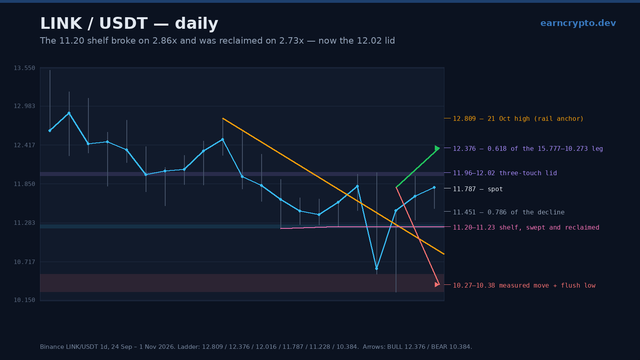
LINK Daily Analysis — The 11.20 Shelf Broke on 2.86x and Was Reclaimed on 2.73x: The 12.02 Lid Decides 12.38 or 10.38
Chainlink swept the 11.20 shelf on 2.86x volume, reversed the whole break on 2.73x and now fights a three-touch 11.96-12.02 lid. 12.02 decides 12.38 or 10.38.