
SUI Daily Analysis — Six Sessions, 40%: The $0.9723 Retrace Decides $1.0158 or $0.8497
SUI has closed higher six sessions running and cleared the August spike high at $0.9540; the 0.786 retrace at $0.9723 now decides $1.0158 or a $0.8497 refill.
The triangle resolved the other way
When the September 15 note mapped a descending triangle with its floor at 0.6926, the obvious read was a downside break toward the August low. The floor did break first: September 15 printed 0.67300 on 77.1 million tokens. What happened next is why the pattern matters more than the prediction — the market reclaimed it inside four sessions and never traded back below it.
Since then SUI has produced 6 consecutive higher closes: 0.71350, 0.74130, 0.81440, 0.85750, 0.89740 and 0.95910 today. That is 39.6% from the September 15 close of 0.68690, and the descending line — anchored on the August 22 spike high of 0.95400 and the September 15 high of 0.72300 — was taken out on September 17, when the session high of 0.74280 closed above a line that had already fallen to roughly 0.7038. A falling line breaking under a rising market is the cleanest failure a wedge can produce.
Advertisement
One Fibonacci rung per session
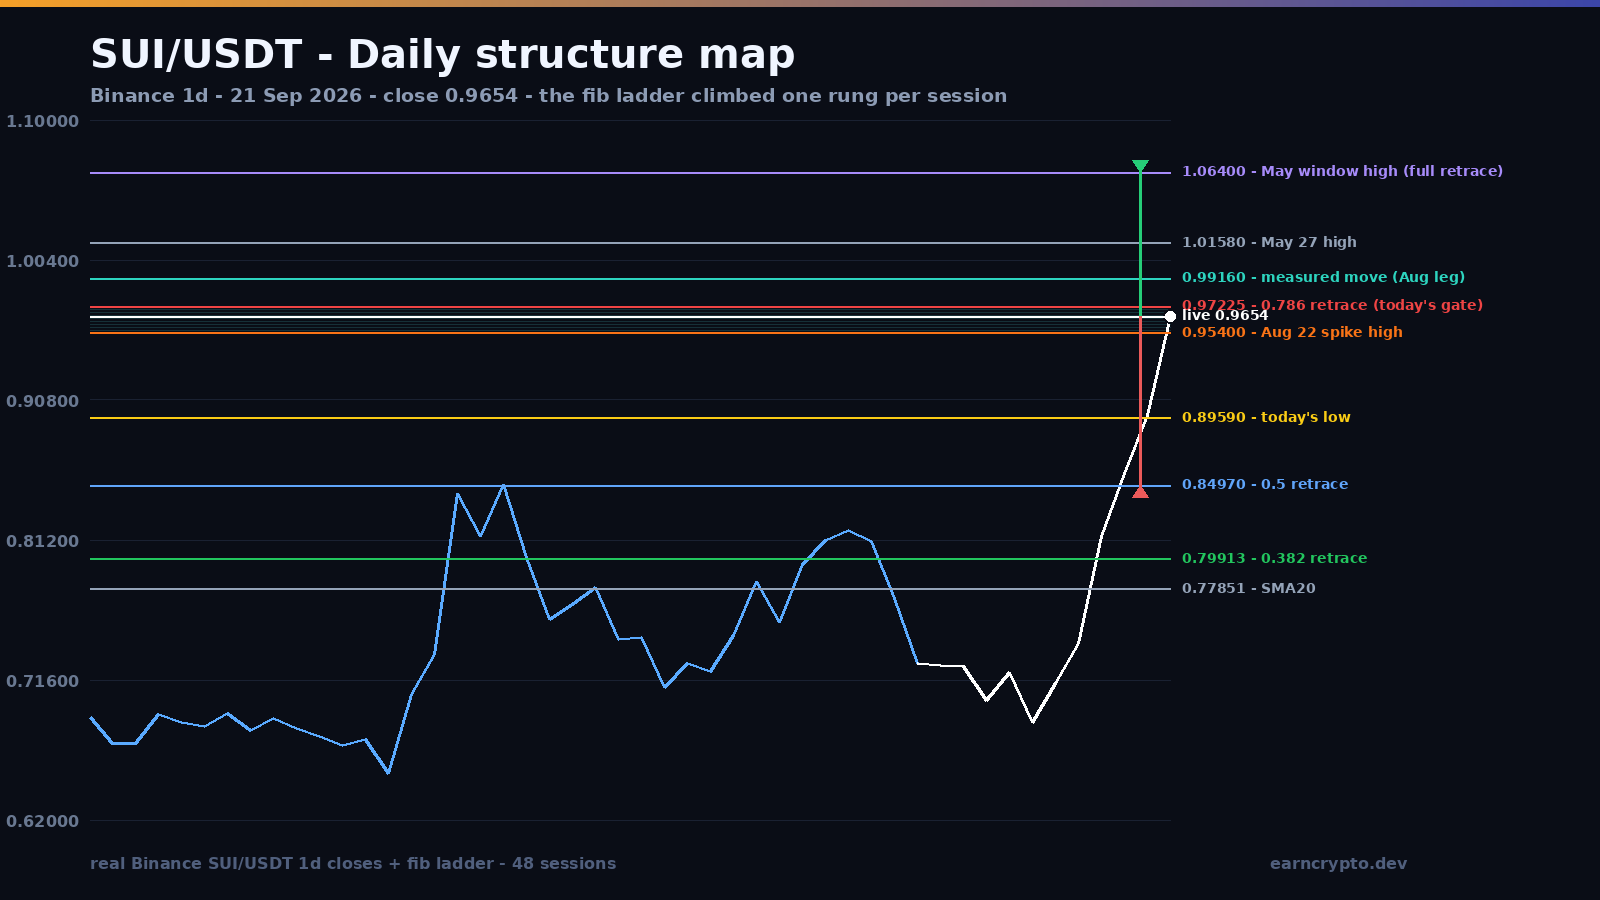
The structure is easier to read against the whole decline. SUI fell from 1.06400 on May 25 to 0.63540 on August 18 — a $0.42860 range — and the retracement ladder of that move runs 0.382 at 0.79913, 0.5 at 0.84970, 0.618 at 0.90027 and 0.786 at 0.97228. The market has been climbing it one rung per session.
September 18 closed 0.81440, above the 0.382. September 19 closed 0.85750, above the 0.5. September 20 closed 0.89740, just under the 0.618, after dipping to 0.80880. Today the session opened at 0.89750 — under the 0.618 — swept 0.89590, and then closed 0.95910, 6.5% above it, with an intraday tag of 0.97840 that reached the 0.786 at 0.97228. Four rungs in four sessions, each one opened below and closed above.
Advertisement
The volume matched the price the whole way: 122,278,302 tokens on September 18 versus a twenty-day average of 80,855,668, 132,796,040 on September 19 and 134,750,232 on September 20 — 1.5x, 1.6x and 1.7x. Today has already traded 82,753,445 with the session only hours old, which is roughly 40% of a full average day. Rungs are being paid for, not gapped through, and that is the difference between a rotation and a squeeze.
The overhead is old and thin — but it exists
Today’s 0.97840 cleared more than the August spike high of 0.95400. It also cleared the entire early-June descending ladder — 0.96270 on May 28, 0.93870 on May 29, 0.91990 on May 30, 0.90360 on June 1 and 0.88050 on June 2 — and retired the 0.85 wall that had capped four earlier attempts, the level the September 11 note was watching. Above the current print the next reference is 1.01580 on May 27, then 1.05800 and the window high of 1.06400. Between 0.97840 and 1.01580 there is nothing: a 3.8% vacuum that a market in this state of momentum can cross in a single session.
The measured move agrees with the vacuum. The August rebound leg ran from 0.63540 to 0.95400, a $0.31860 range, and projecting that from the September higher low at 0.67300 gives 0.99160 — 1.6% under the May 27 high. So the honest target band for this leg is 0.99160-1.01580, and it is where the move should be judged rather than chased.
What has to hold
The first support is today’s low at 0.89590 and the reclaimed 0.618 at 0.90027. Below that the ladder is dense and well-defined: September 19’s close at 0.85750, the 0.5 retracement at 0.84970, September 18’s close at 0.81440 and the 0.382 at 0.79913. The twenty-day average sits at 0.77825 and the fifty-day at 0.74342, so the entire price structure of the last four sessions is above both.
The invalidation structure is simple: for the bull read, a daily close back under 0.85750 would put the market below two rungs it has already paid for, and losing 0.84970 — the 0.5 and the round half-dollar zone on the same tick — would mean the six-session run was a squeeze rather than a re-rating. For the bear read, a close above 1.01580 flips the remaining May supply and turns 1.06400 into the next objective.
The one thing worth respecting here is extension: the close is 23.2% above the twenty-day average, and 6 consecutive up sessions is the longest streak in the 120-session window. Vertical legs rarely fail because they are high — they fail when the first pullback cannot hold a rung. That is why 0.90027 and 0.84970 matter more than 1.01580 does right now.
The two paths
Bull case: hold 0.97228 and the next prints are mechanical. 0.99160 first — the measured projection — then the 1.01580 May high, with 1.06400 as the full-retracement objective. The path needs one condition: a daily close above 0.97228. Today tagged it from below and closed under it, which is exactly the situation AVAX was in on Friday before its own vertical leg continued — the first close above the rung is what converts an extended candle into a trend.
Bear case: it needs nothing more than one rejected retracement. A close back under 0.90027 followed by a failure at the 0.5 retracement at 0.84970 would open 0.81440 and 0.79913, and below there the twenty-day average at 0.77825 is the last real line before the September base. Probabilities are not certainty: 40% in six sessions argues for continuation while the 0.786 holds, but it also means the crowd is long and the stop-loss cluster under 0.84970 is thick.
Six sessions, one rung each: 0.79913, 0.84970, 0.90027 and now 0.97228. The trade is no longer about whether SUI can bounce — it is about whether 0.97228 becomes support. Everything above 1.01580 is old supply; everything below 0.84970 is this week’s profit.
Written by
EarnCrypto.dev Editorial
The EarnCrypto.dev editorial team researches and reviews AI mining platforms, pools and earning tools — publishing only what passes our own checks.
Related reading

SOL Daily Analysis — Three Touches Under the $120.00 Round Number: The 114.29 Retrace Decides 126.56 or 105.05
Solana has been rejected at the $120.00 round number three sessions in a row after a 25% week. The $114.29 retrace decides whether 126.56 or 105.05 comes next.

BTC Daily Analysis — The 82,300 Box Broke: The 87,396 Double Touch Decides 90,776 or 82,648
Bitcoin broke its five-week $82,300 box on 21 September and has coiled under $87,396 since. The $84,463 retrace decides whether 90,776 or 82,648 comes next.

BNB Daily Analysis — The $780.64 Ceiling Broke: The 782.98 Retrace Decides 858 or 741
BNB cleared the $780.64 ceiling that had held since September 5 and reversed to 782.75 today, two ticks off the 782.98 retracement. The measured move is 858.