
SUI Daily Analysis — Descending Triangle at $0.6926: The Floor Decides 0.7947 or a 0.6354 Retest
Sui daily TA: six lower highs under $0.8447 and a three-touch $0.6926 floor on the 0.786 fib — the triangle resolves into 0.7947 or a full 0.6354 retrace.
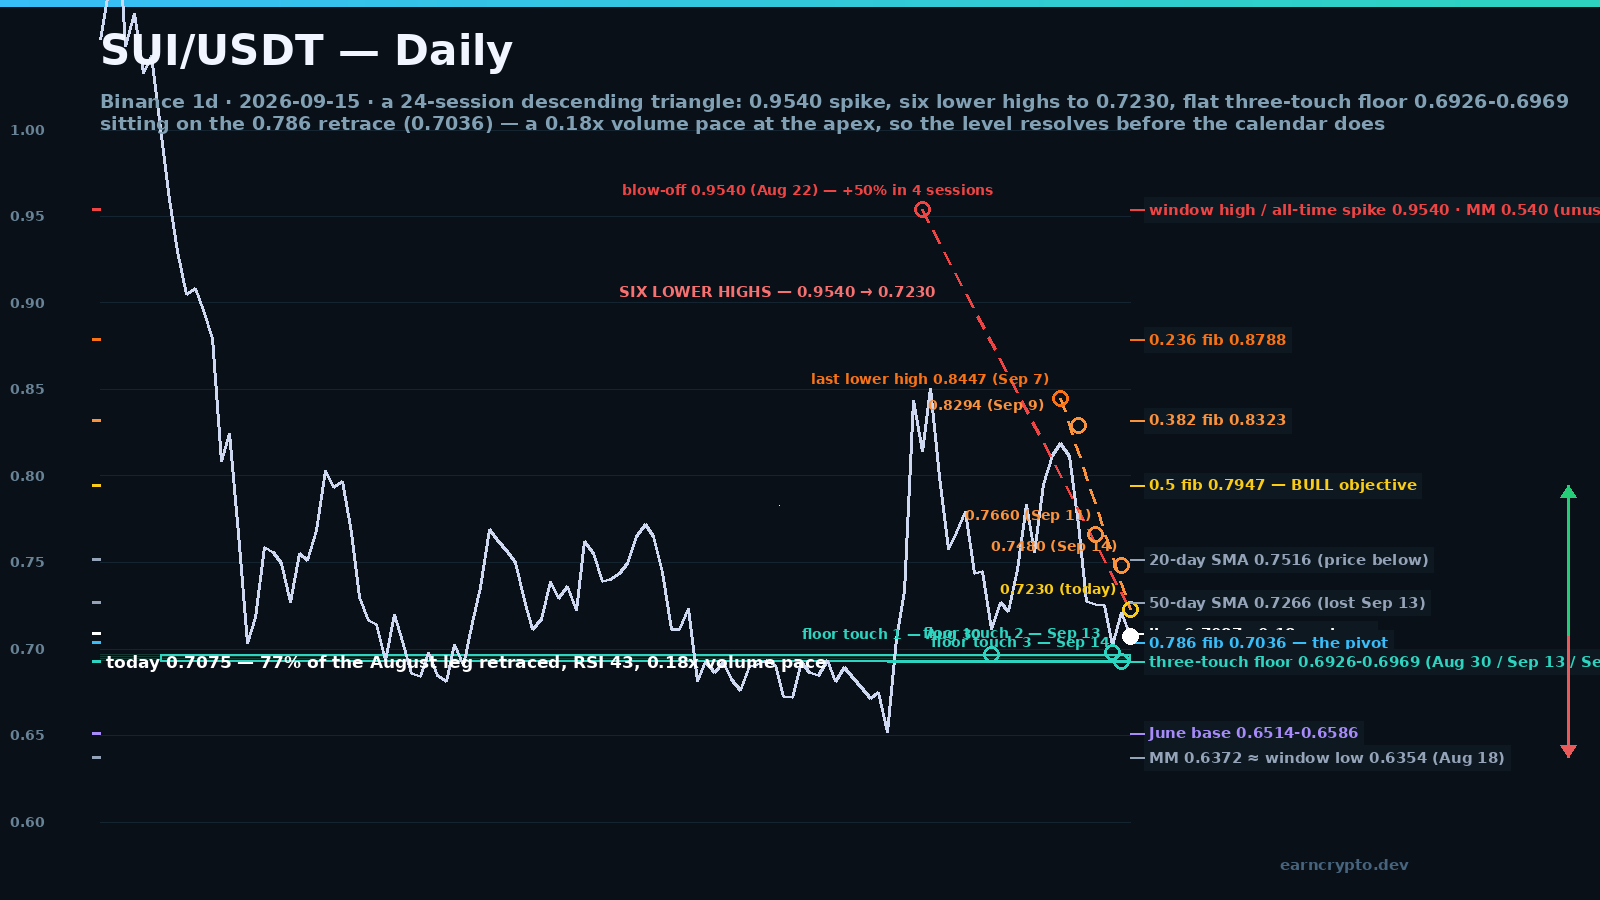
Sui is holding $0.7071 at the time of writing after a 1.73-cent range — 0.7230 high, 0.7057 low — with 12.37M tokens traded, a 0.18x pace against the 20-day average of 69.2M. Volume this thin at the apex of a three-week compression is the market refusing to choose a side before the level does it for them.
The context is a 50.1% rally in four sessions. SUI bottomed at 0.6354 on August 18, ran through 0.7249, 0.7532 and 0.8623 and spiked to 0.9540 on August 22 on 158.5M tokens — 2.37x average — then closed that session at 0.8142, fifteen percent under its own high. Twenty-four sessions later the price is 25.9% below that spike, and the structure that has formed in between is a textbook descending triangle.
Advertisement
Six lower highs into one flat floor
The falling side is clean: 0.9540 on August 22, 0.8575 on August 23, 0.8509 on August 24, 0.8447 on September 7, 0.8369 on September 8, 0.8294 on September 9, 0.7660 on September 11, 0.7480 on September 14 and 0.7230 today. The last six are consecutive — no session in nine days has closed above the previous swing high, and the September rail from 0.8447 has been defended on declining volume each time.
The flat side is the part that matters. Three separate sessions have printed a low inside the same 0.0043: 0.6969 on August 30, 0.6977 on September 13 and 0.6926 on September 14. Today's low of 0.7057 held 0.0131 above the lowest of the three. A floor that has been bought three times is not a coincidence, and until it prints a daily close beneath it the triangle is unresolved.
Advertisement
The 0.786 retracement of the entire August reversal (0.6354 to 0.9540) sits at 0.7036, 0.0035 under today's price. That means 77% of the rally has already been retraced — the zone where this kind of move either finds real buyers or completes the round trip. The 20-day SMA at 0.7516 and the 50-day at 0.7266 are both above spot, which is the mechanical reason every bounce has been capped.
The measured move points at the window low
Take the September 13-14 leg: 0.7480 minus 0.6926 equals 0.0554. Projected from the floor, that is 0.6372 — eighteen ticks from the August 18 window low of 0.6354, which is also the 100% retrace of the rally. Two independent counts land on the same price, and between here and there the only shelf is the June 24-26 base at 0.6514-0.6586. That is the bear objective, and it is a full 10% under spot.
BULL case — reclaim the 50-day and the rail flips
The first tell is a daily close above 0.7312, the September 13 high. That opens 0.7480 (September 14) and then 0.7660, the September 11 lower high where 0.7571 (0.618 fib) also sits. Above that, the 0.5 fib at 0.7947 is the objective and it coincides with the point where the descending rail and the falling 20-day SMA meet in early October — the reason this is a target, not a hope. Watch the volume on the reclaim: the two rallies that followed spikes this month (September 3 and September 7) both printed above 1.4x average and were sold anyway. A reclaim on 0.5x average will not hold. Probability around 40-45% while the floor keeps holding and volume dries up, and the bull case dies on a daily close under 0.6926.
BEAR case — the floor is the whole trade
A daily close below 0.6926 breaks a level that has been bought three times, and the move that follows has a measured objective at 0.6372. The path will not be straight: expect a sweep to 0.6850 that gets bought, a weak bounce to 0.7050 that fails, and then the June base at 0.6514-0.6586 to absorb the first real flush before the 0.6354 window low gets tested. Probability around 55-60% while price sits under both moving averages, RSI is 43.4 and every September rally has been sold into.
ATR(14) is 0.0456, or 6.4% of spot — the highest of the twelve largest-capitalisation names we screen. At this volatility the distance between the floor and the measured move is roughly three average daily ranges, which is why a stop placed a few ticks under the floor is a donation rather than a risk plan.
Everyone who bought the 0.9540 spike is now a seller into rallies, and the floor has been bought three times on declining volume — that is either accumulation or a vacuum. I want the break, not the guess: lose 0.6926 and 0.6372 is the trade, reclaim 0.7480 and the 0.7947 retrace opens.
Fundamentally there is a counterweight: the spot ETF inflow streak through August ran twelve consecutive weeks without an outflow, the network printed 8.5M transactions in a single day on August 22 — a 90-day high — and Sui Basecamp lands on October 7-8, which is when the apex of this triangle would already be resolved. That is context, not a trigger. The chart's answer comes from whether 0.6926 holds this week.
Levels and live candles: SUI/USDT on Binance · Sui on CoinGecko · Sui network data on DefiLlama · our earlier SUI coverage: twelve straight weeks of ETF inflows
Written by
EarnCrypto.dev Editorial
The EarnCrypto.dev editorial team researches and reviews AI mining platforms, pools and earning tools — publishing only what passes our own checks.
Related reading

SOL Daily Analysis — Three Touches Under the $120.00 Round Number: The 114.29 Retrace Decides 126.56 or 105.05
Solana has been rejected at the $120.00 round number three sessions in a row after a 25% week. The $114.29 retrace decides whether 126.56 or 105.05 comes next.

BTC Daily Analysis — The 82,300 Box Broke: The 87,396 Double Touch Decides 90,776 or 82,648
Bitcoin broke its five-week $82,300 box on 21 September and has coiled under $87,396 since. The $84,463 retrace decides whether 90,776 or 82,648 comes next.

BNB Daily Analysis — The $780.64 Ceiling Broke: The 782.98 Retrace Decides 858 or 741
BNB cleared the $780.64 ceiling that had held since September 5 and reversed to 782.75 today, two ticks off the 782.98 retracement. The measured move is 858.