
LINK Daily Analysis — Seven Consecutive Lower Highs on a Four-Session 11.20 Floor: 11.629 Decides 12.95 or 10.62
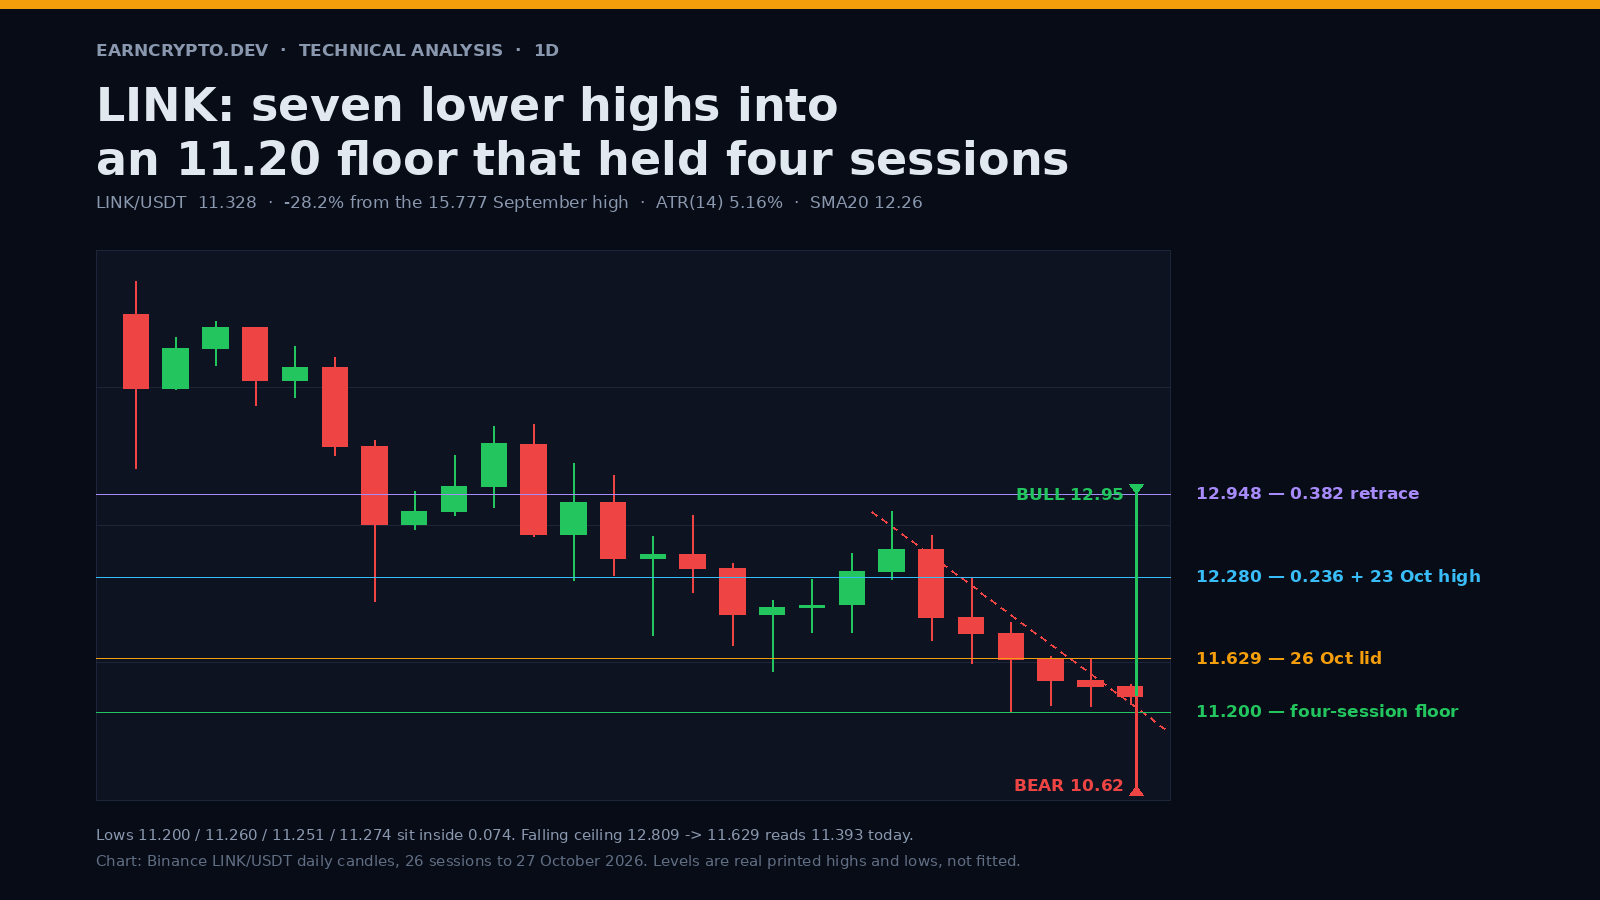
LINK has printed seven straight lower highs and four sessions inside 0.074 above 11.20. A close over 11.629 opens 12.28; a loss of 11.20 points to 10.62.
Seven sessions, seven lower highs
Chainlink topped at 15.777 on 29 September on 5.50 million tokens, 1.73 times the trailing twenty-day average, one session after a 10.18% candle that ran to 15.534 on 8.63 million. Nothing since has come close. The last seven sessions have each printed a high below the one before it: 12.809 on 21 October, then 12.615, 12.281, 11.917, 11.647, 11.629, and 11.425 today.
From that top to the 24 October low at 11.200 the market has given back 4.577 points, 29.0%. Spot is 11.334 at the time of writing, 28.2% under the September high and 1.2% above the low.
Advertisement
The falling ceiling through 12.809 and 11.629 reads 11.393 for today, a slope of minus 0.236 a session. The 22 October high at 12.615 stopped 0.042 under it, which is a touch and not a break, and today's 11.425 high pokes 0.032 above it. A wick through a rail is not a reclaim. A close is.
A floor that has stopped moving
Four sessions have now bottomed at 11.200, 11.260, 11.251 and 11.274. The spread is 0.074, or 0.66% of spot. ATR(14) is 0.584, 5.16% of price, so one average daily range is roughly eight times the distance between the floor's own prints. That is compression rather than support: a level that holds because nobody is trading it is a decision being deferred.
Advertisement
Volume tells the same story. The 24 October session that printed the 11.200 low traded 1.79 million LINK, 1.09 times its own trailing twenty-day average, the heaviest of the last six sessions. The 25 October session that held the floor traded 0.98 million, 0.59 times. Today's 0.44 million is a 0.26x pace on a partial session, so read it as directionless rather than dry.
The bull case: 11.629 is the gate
The 0.236 retrace of the 15.777 to 11.200 slide sits at 12.280. The 23 October high printed 12.281, one-thousandth of a point away. That is both the first target and the point where a squeeze stops being noise.
The path runs: a daily close above 11.629, the 26 October high, then acceptance over the falling rail, then 12.280. A close above 12.280 clears the 0.236 and opens 12.948, the 0.382 of the same leg. The 1.415-point range of 22 October, measured from the floor, projects 12.615 on a full retrace, so the two methods land in the same zone. Expect the first attempt to fail: the 20-day average at 12.258 is still falling and will sit right on top of it.
I put the bull path near 35% on a one-week view. Not because the structure is bullish, it is not, but because four sessions of 0.66% compression under a thrice-tested rail usually resolve with a violent squeeze in whichever direction the range breaks.
The bear case: 11.20 is the last shelf before 10.98
A daily close under 11.200 ends the four-session floor and puts the 17 September low at 10.984 in play, the last print below 11.20 anywhere in the window. Behind it sits 10.617 from 16 September, the base of the entire advance to 15.777, which is also the bear objective our 21 October note carried.
Measured: the 22 October range ran 12.615 to 11.200, 1.415 points. Projected down from a break of 11.200 that gives 9.785, a 13.6% move from spot that needs a catalyst rather than drift. The honest order is 10.984 first, 10.617 second, 9.79 as the tail.
What would confirm it: a session closing under 11.20 on more than 1.5 million LINK. The 24 October break that set the floor came on 1.09x volume, moderate rather than capitulation. A real flush looks like 8 October, when 3.06 million changed hands and price lost 4.65% in one session.
What invalidates both
Bull invalidation is a daily close under 11.200. Note that 12.280 is not bull confirmation either: it is the first shelf, and a rejection there that prints a lower high would reset the seven-session sequence rather than end it.
Bear invalidation is two consecutive closes above 12.280, or one close above 12.948. At that point the sequence of lower highs is broken and the 0.5 at 13.489 comes into play.
Between 11.20 and 11.63 there is no trade worth taking. The band is 0.43 points, 3.8% wide, and the intraday noise inside it is larger than a stop can survive on a 5.16% ATR.
A floor that holds four sessions inside 0.66% of spot is not support. It is a decision being deferred.
Written by
EarnCrypto.dev Editorial
The EarnCrypto.dev editorial team researches and reviews AI mining platforms, pools and earning tools — publishing only what passes our own checks.
Related reading
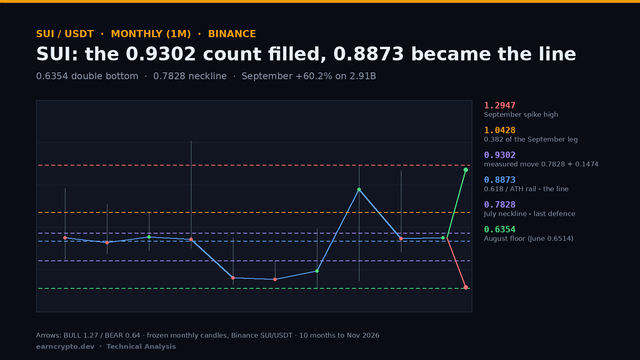
SUI Monthly Analysis — A 0.6354 Double Bottom Filled Its 0.9302 Count: The 0.8873 Retrace Decides 1.0428 or 0.7828
SUI filled the 0.9302 count of its 0.6354 double bottom at September's high and gave 22.8% back in October. The 0.8873 retrace now decides 1.0428 or 0.7828.
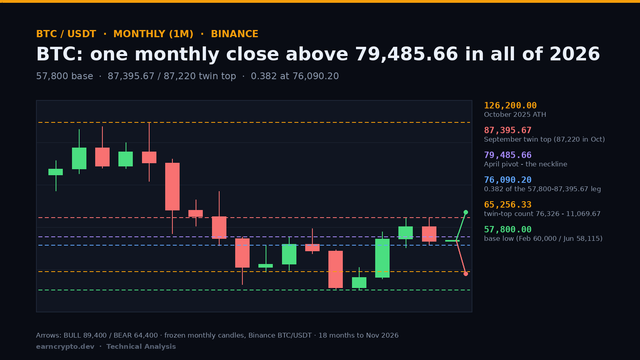
BTC Monthly Analysis — A Single 2026 Close Above 79,485.66 and an 87,395.67 Twin Top: 76,090 Decides 89,400 or 65,256
BTC closed October at 77,582, -7.2% under its open and back below the 79,485.66 pivot. The 76,090.20 retrace now decides whether 89,400 or 65,256 comes first.
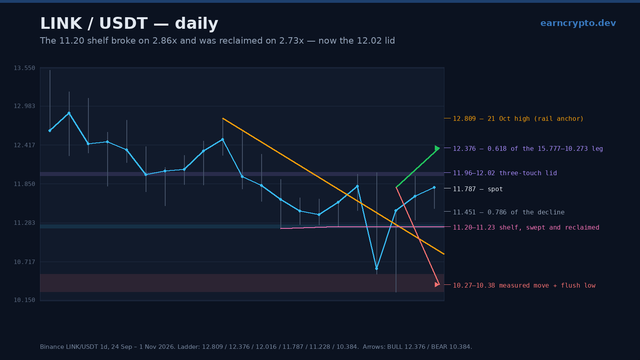
LINK Daily Analysis — The 11.20 Shelf Broke on 2.86x and Was Reclaimed on 2.73x: The 12.02 Lid Decides 12.38 or 10.38
Chainlink swept the 11.20 shelf on 2.86x volume, reversed the whole break on 2.73x and now fights a three-touch 11.96-12.02 lid. 12.02 decides 12.38 or 10.38.