
LINK Daily Analysis — An 11.531 Sweep of the 0.786 and a Six-Touch Ceiling Broken: The 12.588 Retrace Decides 13.197 or 10.617
LINK swept 1.62% under the 0.786 at 11.721 to 11.531, closed 4.42% off the low on four rising closes. Over 12.588 opens 13.42; under 11.531 gives 10.617.
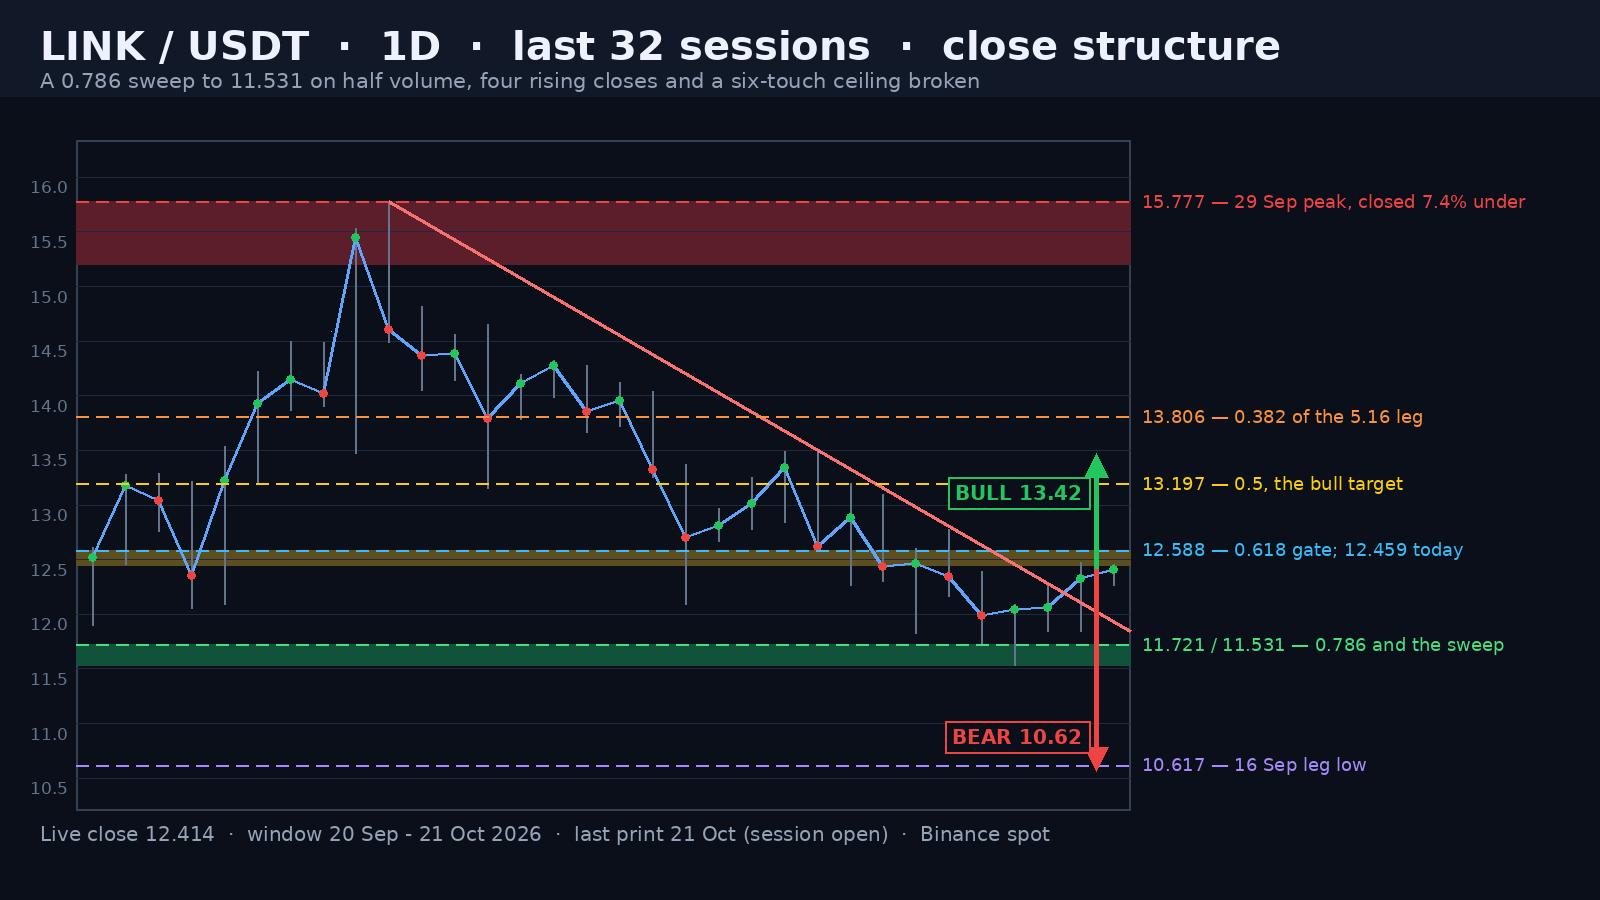
Chainlink printed 15.777 on 29 September, one session after a 10.18% day on 3.03x the twenty-day average. The peak candle itself closed at 14.607 — 7.42% under its own high — and that gap is where the correction started. Nineteen sessions later the market traded 11.531 on 18 October: 26.91% below the peak, and 1.62% below the 0.786 retracement of the entire advance at 11.721.
The 0.786 Was Swept on Half Volume
The 18 October session is the one that matters. It printed 11.531 on 0.51x the trailing twenty-day average, then closed at 12.041 — 4.42% above its own low — and every session since has closed higher: 12.060, 12.332 and 12.420 today. Volume that light through a level that important is not distribution. It is a stop run: the prints below 11.721 belonged to whoever had stops there, not to sellers with size.
Advertisement
Four Rising Closes and a Ceiling That Broke
The descending rail from the 29 September peak through the 12 October high at 13.506 contained this market for six sessions. It tagged 12 October exactly, missed 14 October's high by 0.057, 16 October's by 0.031 and 19 October's by 0.016. Then 20 October closed 0.367 above it and today held the break with a close 0.525 above the rail's projection. Six touches and a break is the most useful thing on this chart, because it is the first objective evidence that the correction's supply is finished.
A sweep 1.62% under the 0.786 on half volume, a close 4.42% above the low, four rising closes and a six-touch ceiling broken. That is a reversal setup, not a confirmed reversal — the 0.618 at 12.588 is still overhead and it has not been closed above since 13 October.
The Gate Is 12.588
Today's high of 12.459 stopped 0.13 under the 0.618 and yesterday's 12.475 stopped 0.11 under it. Two sessions, two failures inside 12.46-12.48. Above the gate sit the 0.5 at 13.197 and, in the way, a moving-average cluster at 12.700 (the 50-day) and 13.038 (the 20-day) — price is 2.20% below the first and 4.74% below the second, so a reclaim of 12.588 does not open clean air, it opens a fight.
Advertisement
What the Bull Case Needs
A daily close above 12.588. That turns the 0.786 sweep into a failed breakdown in hindsight, and the base it has built — 11.531 to 12.475, a height of 0.944 — projects 13.419, which sits between the 0.5 at 13.197 and the 0.382 at 13.806. The measured move and the fib ladder point at the same 13.20-13.42 band, and that is the first area where the bears have to make a stand rather than just lean on a rail.
What the Bear Case Has
A daily close under 11.531. That kills the sweep, re-opens the 0.786 and puts 10.617 — the 16 September low where the whole advance began — on the table, with the 0.236 extension of the drop at 10.529 sitting 0.83% underneath it. The bears also still own both moving averages and every rally since 29 September has failed at a lower high until this week, so the burden of proof is on the buyers.
I would call this 55/45 in favour of the upside, which is a change from how this chart read a week ago. The reasons are specific: the sweep happened on 0.51x volume and closed 4.42% off the low, the four sessions since have printed higher closes, and the descending rail that defined the correction has been broken and held. The 14-day ATR of 0.659, or 5.30% of spot, means the market can cover the 0.17 to the gate in a single ordinary session — the question is whether it can close there.
Two lines settle it. A daily close above 12.588 confirms the failed breakdown and opens 13.20-13.42. A daily close below 11.531 re-opens 10.617. Between them, the market is a 0.94-wide base with rising lows and no volume, and the only thing that has changed in five sessions is that the ceiling above it is gone.
Written by
EarnCrypto.dev Editorial
The EarnCrypto.dev editorial team researches and reviews AI mining platforms, pools and earning tools — publishing only what passes our own checks.
Related reading
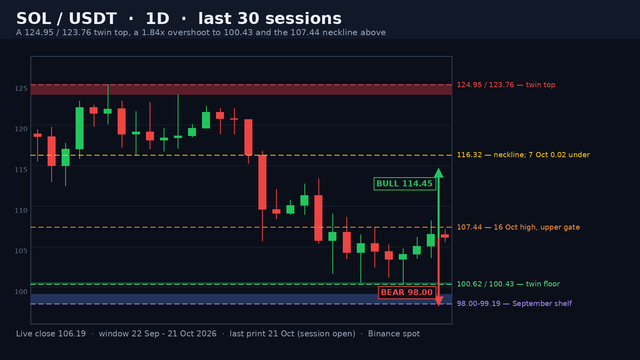
SOL Daily Analysis — A 100.43 Twin Floor After the 1.84x Breakdown Count: The 107.44 Neckline Decides 114.45 or 98.00
SOL daily: the 124.95/123.76 twin top overshot its 107.69 count to 100.43 and built a twin floor. A close over 107.44 opens 114.45; under 100.43 gives 98.00.
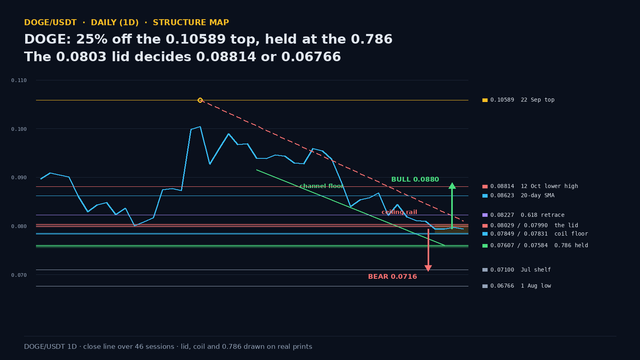
DOGE Daily Analysis — 25% Off the 0.10589 Top Held at the 0.786: The 0.0803 Lid Decides 0.08814 or 0.06766
DOGE is 25% under its 22 September top and has coiled for three sessions at 0.0800 with the 0.786 at 0.07584 intact. The 0.0803 lid decides 0.08814 or 0.06766.
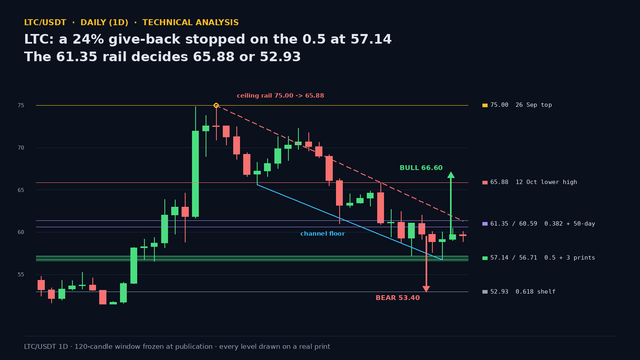
LTC Daily Analysis — A 24% Give-Back Stopped on the 0.5 at 57.14: The 61.35 Rail Decides 65.88 or 52.93
LTC's 24.4% give-back from the 75.00 top stopped on the 0.5 at 57.14 after three lower highs and three lower lows. No close has broken it. 61.35 decides.