
SOL Daily Analysis — A 100.43 Twin Floor After the 1.84x Breakdown Count: The 107.44 Neckline Decides 114.45 or 98.00
SOL daily: the 124.95/123.76 twin top overshot its 107.69 count to 100.43 and built a twin floor. A close over 107.44 opens 114.45; under 100.43 gives 98.00.
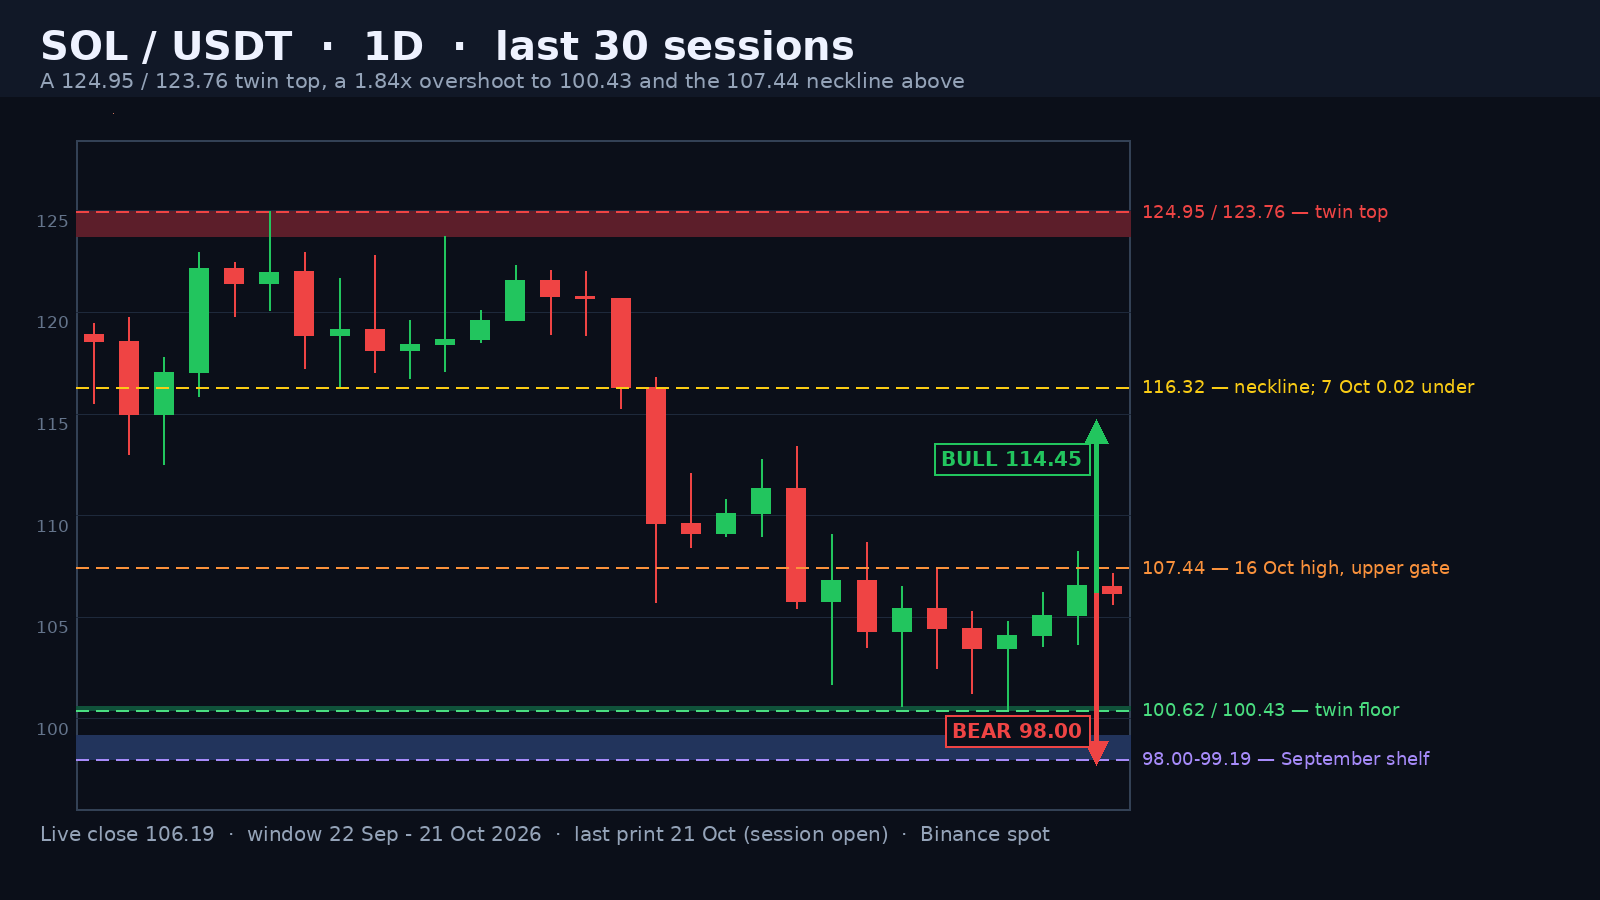
Solana printed 124.95 on 27 September and 123.76 on 2 October — a double top inside 0.95% with 116.32 as the neckline between them. The first print came on 2.60 million SOL, 0.99x its trailing twenty-day average; the retest five sessions later came on 3.21 million, 1.20x. The height of the pattern, 8.63 points, projected a measured move of 107.69. The market delivered 15.89 points instead — 1.84x the count, over 21 sessions, a 19.62% decline from the high to the 18 October low at 100.43.
A Count That Overshot Is No Longer a Breakdown
There is a difference between a measured move that fills and one that is overrun by 84%. The first is a trend doing normal work. The second is the tail end of a move, where the last sellers hit whatever bid is left. The tell here is where the arithmetic landed: the projection was 107.69, and the 8 October session closed at 109.62 — already under the neckline by 6.70 on 1.35x the twenty-day average — before the market went on to 100.62 on 15 October and 100.43 on 18 October.
Advertisement
Two Lows 0.19 Points Apart on Half the Volume
The 15 October session printed 100.62 on 1.32x the trailing twenty-day average. Three sessions later, the 18 October session printed 100.43 — 0.19 lower, a 0.19% undercut — on 0.75x the average. A marginally lower low on 43% less volume is not a fresh breakdown; it is the same shelf being retested by a smaller seller. Between the two sits the 16 October high at 107.44, which is the neckline of the base they form.
The Gate Is 107.44, and Nobody Has Closed Above It
The 20 October session traded up to 108.25 — 0.81 through the neckline — and closed at 106.54. Today's high of 107.13 stopped 0.31 short of it. Above the level there are three more real prints from the same decline — 108.67 from 14 October, 109.07 from 13 October and 113.40 from 12 October — which is why 107.44 matters as a gate rather than as a target: it is the first close that would break the sequence of lower highs that has run since 12 October.
Advertisement
A double top that overshoots its own count by 84% and then builds a shelf on half the volume is not a market with momentum. It is a market that has found a price where the sellers stop. The question is only whether the bid is strong enough to close above 107.44.
What the Bull Case Needs
One daily close above 107.44. That activates the 7.01-point base and projects 114.45, which is also 1.13 under the 0.382 of the entire 124.95-100.43 decline at 115.58 — one area, two independent pieces of arithmetic. The path is not clean: the 20-day moving average sits at 111.11 and has not been closed above since 11 October, and the retracement ladder runs 109.80 at the 0.382 and 112.69 at the 0.5, so a first attempt at the neckline that fails and revisits 103.50-104.00 would be entirely normal price behaviour, not a broken thesis.
What the Bear Case Has
A daily close under 100.43 fails the only shelf the market has respected in three weeks and reopens 98.00-99.19, the three-touch September base, with 95.82 — the 15 September sweep — behind it. The bears also still own the trend: the decline is intact until 107.44 closes above, the bounce is only 25.3% of the drop, and the 14-day ATR of 4.92 points, or 4.64% of spot, means one ordinary session can erase the whole five-session recovery.
I would call this 55/45 in favour of the floor holding, and the reason is volume, not price: the second floor test came on 0.75x while the first came on 1.32x, and the two sessions that followed printed 0.95x and 1.05x on rising closes. That is accumulation-sized paper, not capitulation-sized paper. It is not enough to call a bottom. It is enough to stop calling this a waterfall.
The lines that settle it are simple. A daily close above 107.44 invalidates the bear case and turns the base into a 114.45 projection with the 115.58 retracement waiting above it. A daily close below 100.43 invalidates the bull case and hands the tape to 98.00. Between those two lines the market is a 7-point range with a downward-sloping memory, and there is no edge in the middle of it.
Written by
EarnCrypto.dev Editorial
The EarnCrypto.dev editorial team researches and reviews AI mining platforms, pools and earning tools — publishing only what passes our own checks.
Related reading
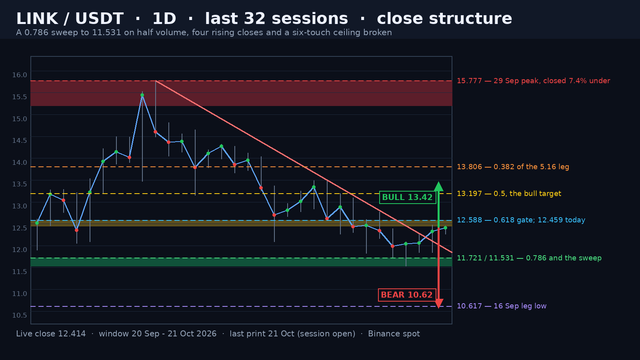
LINK Daily Analysis — An 11.531 Sweep of the 0.786 and a Six-Touch Ceiling Broken: The 12.588 Retrace Decides 13.197 or 10.617
LINK swept 1.62% under the 0.786 at 11.721 to 11.531, closed 4.42% off the low on four rising closes. Over 12.588 opens 13.42; under 11.531 gives 10.617.
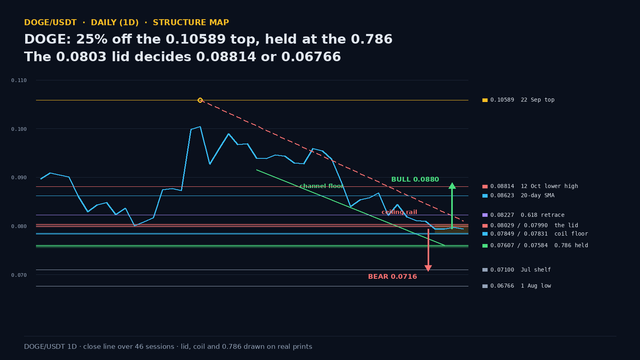
DOGE Daily Analysis — 25% Off the 0.10589 Top Held at the 0.786: The 0.0803 Lid Decides 0.08814 or 0.06766
DOGE is 25% under its 22 September top and has coiled for three sessions at 0.0800 with the 0.786 at 0.07584 intact. The 0.0803 lid decides 0.08814 or 0.06766.
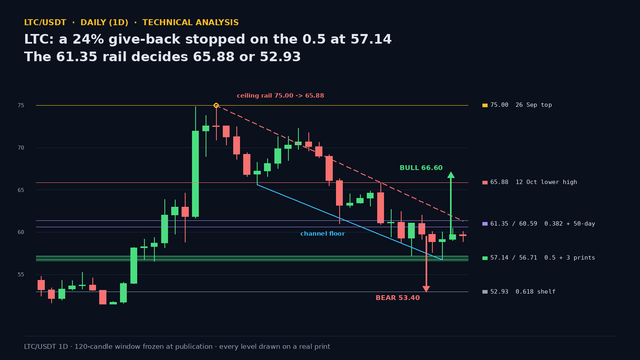
LTC Daily Analysis — A 24% Give-Back Stopped on the 0.5 at 57.14: The 61.35 Rail Decides 65.88 or 52.93
LTC's 24.4% give-back from the 75.00 top stopped on the 0.5 at 57.14 after three lower highs and three lower lows. No close has broken it. 61.35 decides.