
ADA Daily Analysis — A Third Failed Poke Above $0.2584: The 0.2330 Shelf Decides 0.2793 or 0.2301
Cardano poked a new high at 0.2654 on its third attempt above the 0.2584 ceiling and closed back at 0.2551. The 0.2330 shelf decides 0.2793 or 0.2301.
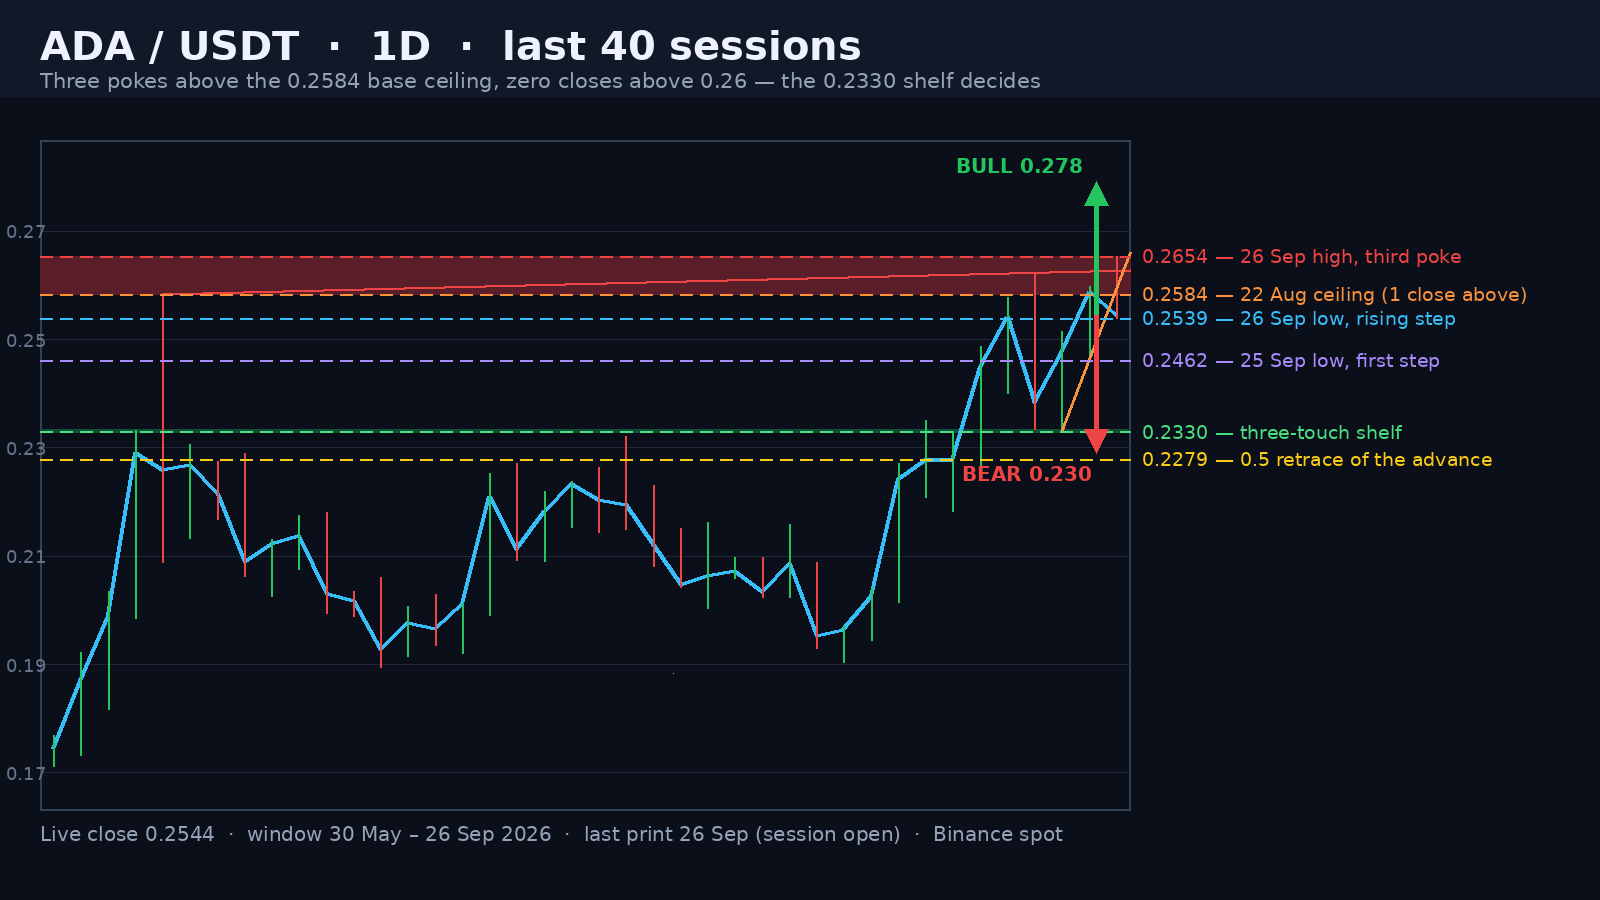
Cardano is trading at 0.2551 mid-session on 26 September, 3.88% under the 0.2654 print it made earlier in the same session — the highest price of the 120 sessions on this chart — and 85% above the 25 June window low of 0.1382. The session has already been both things: it opened at 0.2588, tagged 0.2654 and slipped back to 0.2551, with the low holding at 0.2539. Today's range is 0.0115, or 4.51% of spot, the tightest of the last six sessions, on a 0.38x volume pace against the 20-day average of 179,407,279 ADA.
A 39.5% Advance Into a Five-Week Ceiling
The advance runs from the 16 September low of 0.19030 to today's 0.2654: 0.07510 points, or 39.46%, in ten sessions. The wall in front of it is 0.2584: the 22 August high, which capped every rally for five weeks and which our 9 September note flagged as the upside pivot off the 0.2150 retest. For five weeks the market leaned on it and closed above it exactly once — 25 September, at 0.2588, four ticks through the level. Four ticks is not a breakout. It is a market pushing on a door.
Advertisement
Three Pokes, One Close
The 23 September candle took the ceiling intraday at 0.2623 and gave it straight back, closing at 0.2384 for a 6.25% loss on a 0.0289 true range — 12.1% of price and the widest bar of the last twenty sessions. The 25 September session printed 0.2598 and closed at 0.2588, the highest close in the window, on 224,957,301 ADA — 1.25x the 20-day average. Today's session then printed 0.2654, a new high for the 120 sessions, and slipped back to 0.2551. Three prints above 0.2584 in four sessions — 0.2623, 0.2598 and 0.2654 — and one close above it. Every poke has been sold.
The Rising Steps Underneath
What keeps this from being a plain double top is the floor. The lows since 23 September read 0.2334, 0.2329, 0.2462 and 0.2539 — three higher steps in four sessions, with today's low stopping 1.9% under the 25 September close. Under all of it, the 0.2330 band has three real touches: the 21 August high at 0.2333, the 8 September high at 0.2321 and the 20 September high at 0.2330. That shelf is not decoration — it is where the bear measurement lands.
Advertisement
Where the Measurements Land
Two independent methods point at the same upside zone. The 0.618 extension of the 0.19030-0.2654 advance, measured from the 0.2329 higher low, sits at 0.2793, and the 0.5 extension at 0.2705. Our 21 September note put the objective off the 0.2350 break at 0.2806 — the 0.618 extension is within 0.5% of that number, which is a useful confluence rather than a coincidence. On the other side, the two pokes at 0.2623 and 0.2654 with the neckline at the 25 September low of 0.2462 measure 0.0161 points, projecting 0.2301 — which lands on the 0.2330 three-touch shelf. The retracement ladder of the advance reads 0.24768 (0.236), 0.23671 (0.382), 0.22785 (0.5) and 0.21899 (0.618).
Scenarios and the Invalidation
Above, holding the 0.2539 step keeps the ceiling under pressure; a retest of 0.2588 followed by a daily close above 0.2654 opens 0.2705 and then 0.2793, with the 0.2806 area from our last note sitting inside that zone. Expect the ceiling to be poked again before it goes — three attempts in four sessions is the market wearing a level down rather than a level holding. Below, the neckline is 0.2462: a daily close under it opens the measured move at 0.2301 and the 0.2330 shelf, and below the shelf the 0.5 retrace at 0.22785 and the 16 September base at 0.19030. The bull case dies on a close below 0.22785; the bear case dies on a close above 0.2654.
A five-week ceiling, three pokes above it and zero closes above 0.26 — that is supply being tested, not defeated. But the floor has risen three sessions in a row, and a market that keeps printing higher lows under a level is usually the one that eventually takes it.
The risk is symmetric enough to say so plainly. RSI(14) is 65.6 — firm, not exhausted — while price sits 14% above the 20-day average at 0.22282 and the 14-day ATR is 0.01523, or 6.0% of spot. One average session covers the distance from 0.2551 to either the 0.2462 neckline or the 0.2654 high, which is why a 50/50 read is the honest one: three failed pokes argue for supply, the rising floor plus the highest close of the window argue for absorption.
Watch two lines: 0.2654 above, 0.2462 below.
Binance ADA/USDT live chartOur 21 September ADA note on the 0.2350 break and the 0.2806 targetCardano market data on CoinGeckoWritten by
EarnCrypto.dev Editorial
The EarnCrypto.dev editorial team researches and reviews AI mining platforms, pools and earning tools — publishing only what passes our own checks.
Related reading

SOL Weekly Analysis — A 17-Week Doubling Topped Twice at 124.95 / 123.76: The 116.32 Neckline Decides 124.95 or 100.19
SOL doubled 107.8% in 17 weeks into a 124.95 / 123.76 two-touch top and paid its 108.29 count to 105.71. The 116.32 neckline decides 124.95 or 100.19.

AVAX Weekly Analysis — A 55.2% Thrust and Four 2x-Volume Weeks Under a 12.008 Two-Touch Top: The 10.866 Retrace Decides 14.25 or 8.387
AVAX ran a 55.2% week on 2.27x volume, then coiled four weeks under an 11.799 / 12.008 two-touch top. The 10.866 line decides 14.25 or the 8.387 count.

ETH Daily Analysis — A 2,392.96 Count 94% Filled and Five Rising Lows Back at the 0.382: The 2,635 Line Decides 2,777 or 2,406
ETH's 2,807/2,600 distribution left a 2,392.96 count that went 94% filled at 2,406.11. Five rising lows have retaken the 0.382 — 2,635 decides 2,777 or 2,406.