
ADA Daily Analysis — Five Touches at $0.2350: The Break Decides $0.2806 or $0.2183
ADA has printed five highs inside the same 29-tick band at $0.2321-$0.2350 while every low since September 16 rose. The break decides $0.2806 or $0.2183.
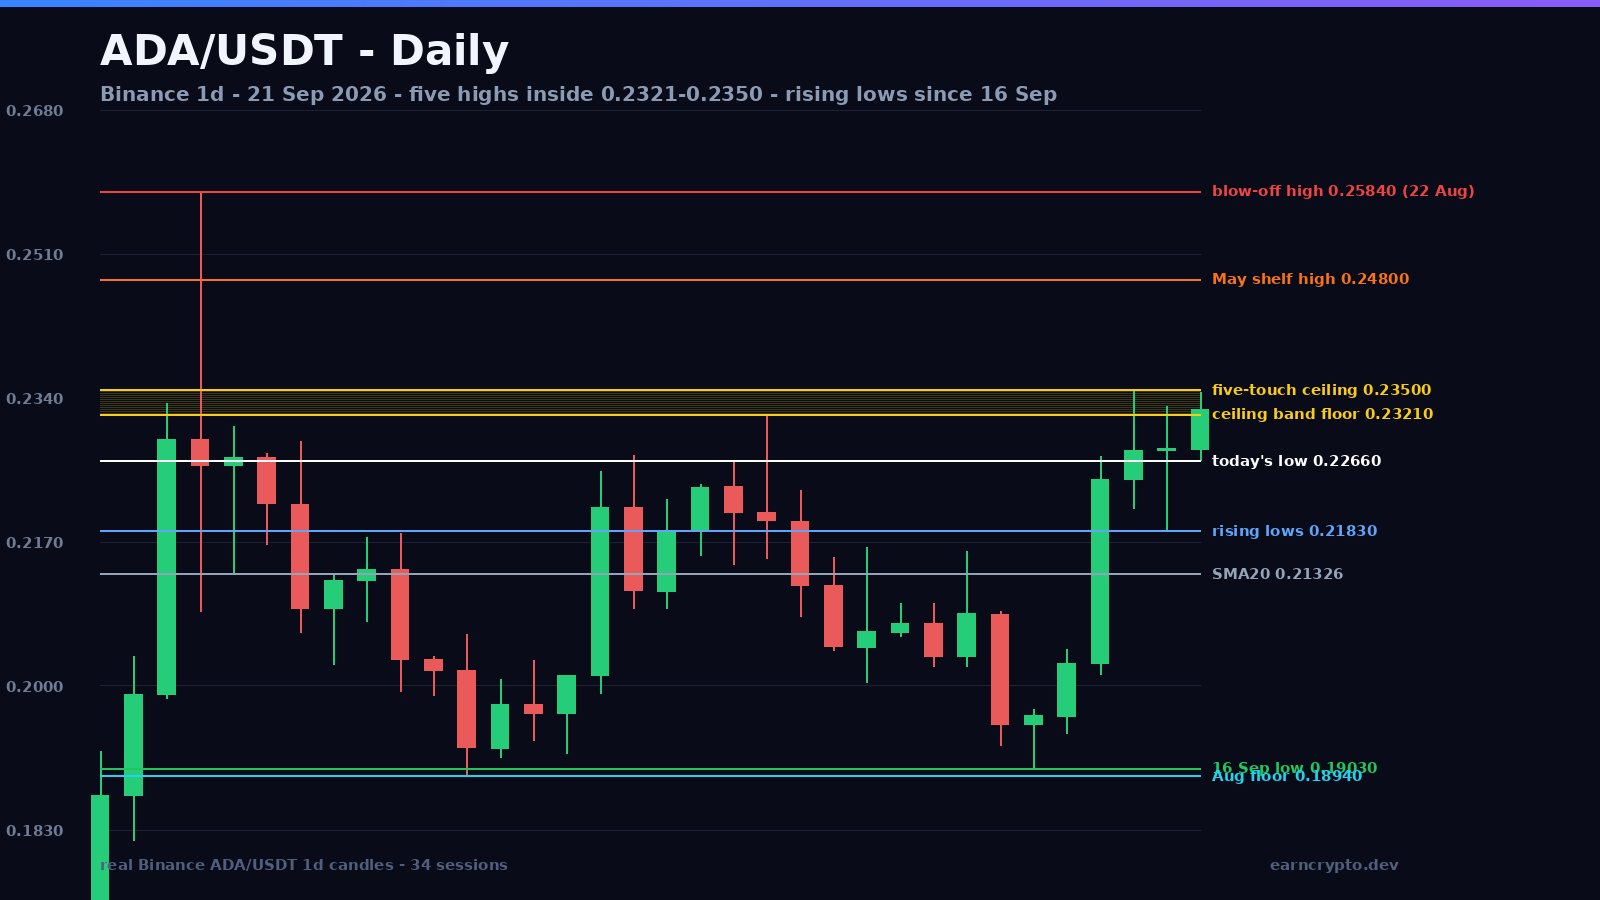
Five highs inside a twenty-nine-tick band
Something unusual has been happening at the top of the ADA range: the market keeps arriving at exactly the same price and stopping. Since August 21, five separate daily highs have printed inside a 29-tick band — 0.23330 on August 21 on 352.5 million ADA, 0.23210 on September 8 on 214.4 million, 0.23500 on September 19 on 189.4 million, 0.23300 on September 20 and 0.23460 today. Five rejections, four of them inside the last four sessions, none of them able to close above the band.
The band was created in one candle. On August 22 the market ran to 0.25840 on 411,954,332 ADA — 2.6x the twenty-day average of 158.1 million and the heaviest print in these 120 sessions — and then closed at 0.22600, 12.5% below its own high. That is not a breakout being defended; that is stock changing hands into strength. Everything above 0.23210 since has been the same exercise, which is exactly what the September 12 note on the double top at 0.23330 was describing before it was visible as a shelf.
Advertisement
The floor has done the opposite of the ceiling
While the highs queued up in a straight line, the lows stopped making sense as a range and started making sense as a trend: 0.18940 on August 30, 0.19030 on September 16, 0.19440 on September 17, 0.20140 on September 18, 0.21830 on September 20 and 0.22660 today. Six lows, each one higher than the last, and the final two are 8.4% apart — the two boundary lines of this structure are not parallel, they are converging, and that only ends one of two ways.
The last test of the lower boundary was not subtle. September 11 swept to 0.20040 on 231.4 million ADA — 1.46x average — and closed back at 0.20640, leaving the 0.618 retracement of the 0.17120 to 0.25840 leg at 0.20451 untested on the downside. That rung is the one the September 9 retest note was built around. Today the same exercise held the 0.382 at 0.22509, with the session low stopping 0.7% above it.
Advertisement
The strongest close since the late-May shelf
September 18 was the session that broke the pattern of failed rallies: a 10.9% close at 0.22440 on 244.7 million ADA, 1.55x the twenty-day average. September 19 followed with the highest print since the August blow-off at 0.23500, September 20 absorbed a dip to 0.21830 and closed unchanged at 0.22790, and today the market is holding 0.23190 — the highest close since May 31, when ADA was selling at 0.23570 on the shelf it now has to climb.
The session is a few hours old and has already traded 63,148,674 ADA, about 40% of what an average full session does against the 158,106,762 twenty-day figure. The range so far is 3.45% against a twenty-day average of 6.35% — compression, which is what a market does immediately before it picks a side. The twenty-day average sits at 0.21321 and the fifty-day at 0.20358, roughly 9% and 14% below the current price: there is a lot of buffer under this market, and that buffer is why the ceiling has to be beaten rather than assumed.
What has to hold
The first line is today’s low at 0.22660. Under it sits 0.21830, the September 20 low and the last of the rising lows — a daily close below that would break the sequence for the first time since September 16 and turn the structure back into the range it has been fighting. The next confluence is a good one: the 0.5 retracement at 0.21480 and the twenty-day average at 0.21321 sit 15 ticks apart, which makes 0.21321-0.21480 the real floor of the bull case rather than either line on its own. Lose it and 0.20451 and the September 11 sweep low at 0.20040 come back into play.
Underneath everything is the double floor: 0.19030 on September 16 and 0.18940 on August 30, with the 0.786 retracement of the August leg at 0.18986 sitting nine ticks from the August low. That is the line the September 12 analysis called the neckline, and it is still the level that would tell you the entire post-August accumulation failed.
The two paths
Bull case: a ceiling tested five times is supply being worked off, and the arithmetic is already on the board. The range from the August trough at 0.18940 to the ceiling at 0.23500 is $0.04560 wide, and it projects 0.28060 above the break. The measured target published on September 12 — 0.27720, from the same range measured to the first rejection at 0.23330 — lands in the same $0.2772-$0.2806 band, which is a rare thing: two measurements of the same market agreeing to a tick. Before that band there is one real obstacle: the late-May shelf, where nine consecutive sessions between May 25 and June 2 printed highs between 0.23130 and 0.24800. A break of 0.23500 that stops at 0.24800 would simply be a pause inside the move, not a failure of it.
Bear case: five rejections is not noise. The sequence of higher closes since September 16 has been paid for with volume, but every one of those sessions ran into the same sellers, and the compression against the band is a two-way setup, not a promise. A third consecutive session capped in the 0.23210-0.23500 zone with fading volume would send the market back through 0.21830 and into the 0.21321-0.21480 confluence, and losing 0.20040 on a closing basis reopens 0.19030. Note too that the same story is playing out across the majors — the Bitcoin daily structure map shows a market sitting directly under an equally well-defended level — and ADA will not outperform a market that fails there.
For a comparable supply-band read, the twelve-touch XRP band from this week resolved by measuring the range rather than predicting the break, and the alternate scenario written here follows the same two-sided logic. The one input that matters more than any of it is volume on the day the band finally gives way: an average-volume close above 0.23500 is a re-rating, a low-volume one is a trap for whoever chases it.
Five highs in the same twenty-nine ticks, six rising lows underneath. The market is not undecided — it is compressed, and a close above 0.23500 or below 0.21830 is how it will tell you which side of 0.28060 and 0.18940 this range belongs to.
Written by
EarnCrypto.dev Editorial
The EarnCrypto.dev editorial team researches and reviews AI mining platforms, pools and earning tools — publishing only what passes our own checks.
Related reading

SOL Daily Analysis — Three Touches Under the $120.00 Round Number: The 114.29 Retrace Decides 126.56 or 105.05
Solana has been rejected at the $120.00 round number three sessions in a row after a 25% week. The $114.29 retrace decides whether 126.56 or 105.05 comes next.

BTC Daily Analysis — The 82,300 Box Broke: The 87,396 Double Touch Decides 90,776 or 82,648
Bitcoin broke its five-week $82,300 box on 21 September and has coiled under $87,396 since. The $84,463 retrace decides whether 90,776 or 82,648 comes next.

BNB Daily Analysis — The $780.64 Ceiling Broke: The 782.98 Retrace Decides 858 or 741
BNB cleared the $780.64 ceiling that had held since September 5 and reversed to 782.75 today, two ticks off the 782.98 retracement. The measured move is 858.