
ADA Daily Analysis — Double Top at $0.2333: The 0.618 Retrace Decides 0.225 or the 0.1894 Neckline
ADA daily technical analysis: a $0.2333/$0.2321 double top with price pinned to the 0.618 at $0.2045 — hold $0.2004 for 0.225, lose it for the $0.1894 neckline.
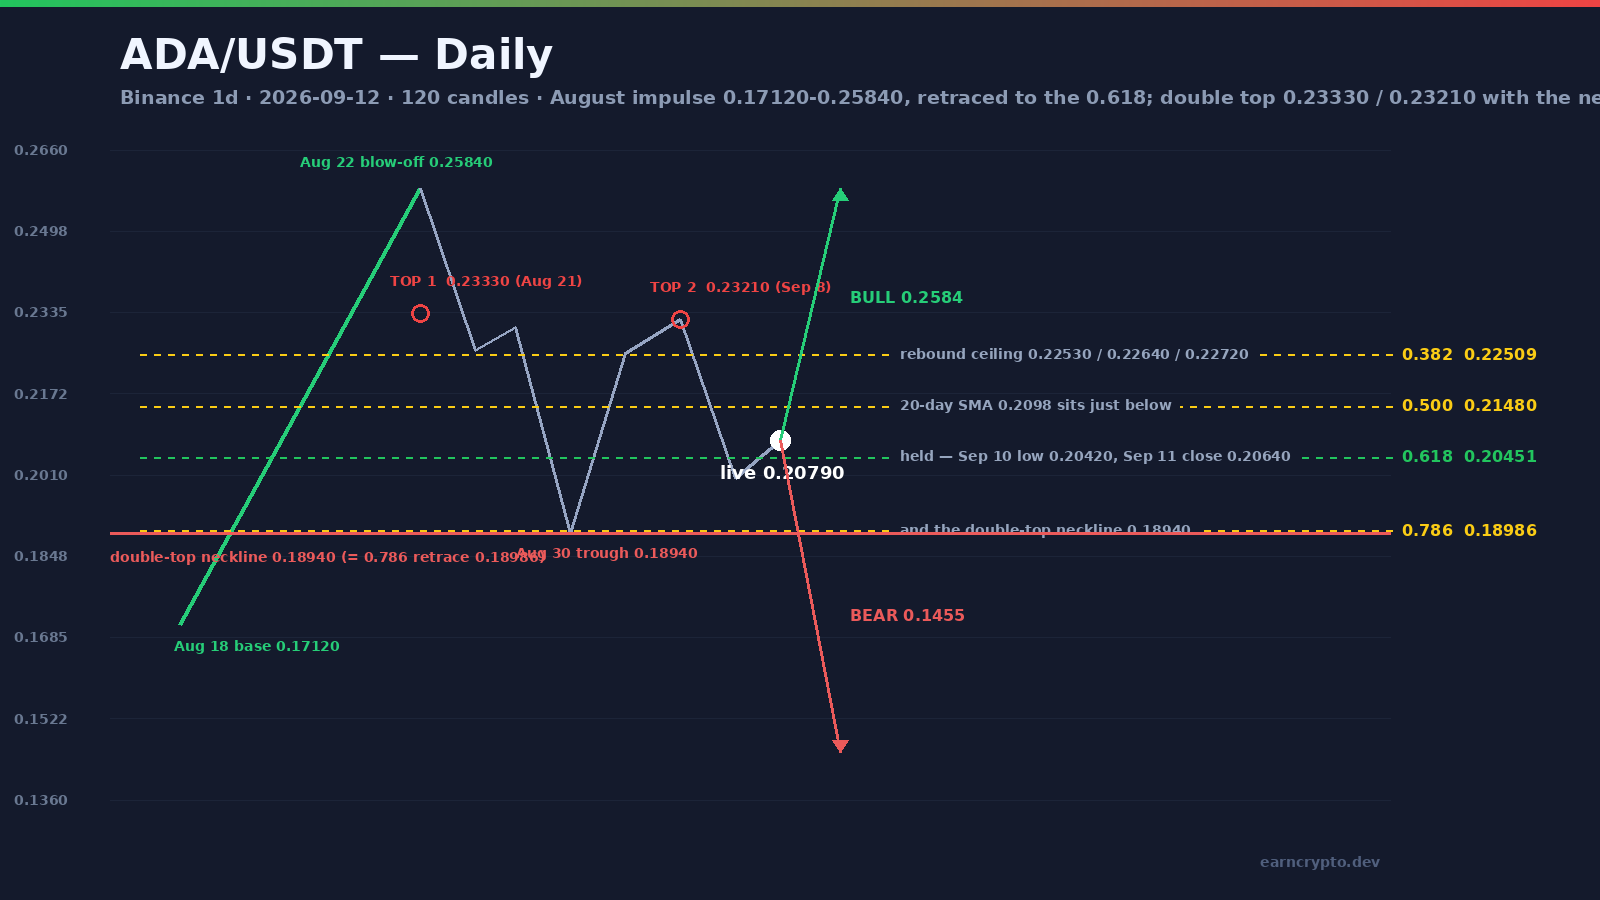
Cardano is one of those charts where the market has already drawn the levels twice, and it is currently sitting on the most important one. The 120-session window contains an August 22 blow-off to $0.25840 that was never revisited, a rebound that died 13 ticks short of the old high, and a double top whose neckline lands within half a cent of the 0.786 retracement of the entire impulse. Today's close of $0.20780 sits almost exactly on the 0.618 of that impulse, with the 20-day average at $0.20976 directly overhead. Nothing between $0.189 and $0.233 matters until one of those two edges gives.
The $0.2584 blow-off and the two tops that frame it
ADA opened the window at $0.26150 on May 16, and most of the 120 sessions have been a repair job. May slid to $0.23290, June turned into a liquidation: $0.20040 on June 3, $0.15670 on June 5 and the window low of $0.13820 on June 25 on 174M ADA — 47% below the May high of $0.26250. July built a base between $0.15540 and $0.20000, and August compressed it further: from August 11 to August 18 the token compressed into a $0.17-$0.19 band on shrinking volume, and that August 18 low of $0.17120 is where everything that followed started.
Advertisement
Then August 19-22 delivered a 51% impulse in four sessions: closes of $0.18710, $0.19900, $0.22910 (+15.1% on 352M ADA) and then the blow-off — August 22 opened at $0.22910, ran to $0.25840 and closed at $0.22600 on 411,954,332 ADA, 2.9x the 20-day average and the heaviest candle of the window. That session closed 12.5% below its own high. $0.25840 has not been seen since.
What followed was a controlled give-back: lower highs at $0.23060, $0.22750 and $0.22890 into the August 30 trough of $0.18940. Then a rebound — September 3 closed +9.9% at $0.22110 on 229M ADA — that ran into a ceiling almost immediately: $0.22530, then $0.22720 (September 4), then $0.22640 (September 7). The final attempt was September 8, which tagged $0.23210 on 214M ADA and closed at $0.21950. Two highs, twelve ticks apart, eighteen sessions apart: $0.23330 (August 21) and $0.23210 (September 8). That is the double top this article is built on, and the trough between them — August 30's $0.18940 — is its neckline.
Advertisement
The 0.382 capped the rebound; the 0.618 is under the price
The impulse from $0.17120 to $0.25840 measures $0.08720, and its retracements explain the last three weeks better than any narrative. The 0.382 is $0.22509 — the rebound's ceiling formed at $0.22530, $0.22640 and $0.22720, all within twenty-two ticks of it. The 0.5 is $0.21480, the 0.618 is $0.20451 and the 0.786 is $0.18986. Cardano has not broken a single one of them; it has simply walked down the ladder.
The pullback followed the same map. September 9 closed at $0.21190, under the 0.5. September 10 low was $0.20420 — three ticks above the 0.618 — and closed at $0.20470. September 11 wicked to $0.20040 and closed back at $0.20640, above the 0.618 again, on 231,359,213 ADA, 1.6x the 20-day average. Today closed at $0.20790 on thin weekend volume. Two consecutive sessions have now defended the same fib, and the level they defended is $0.20451.
Here is the confluence that makes $0.189-$0.190 the number for this article. The 0.786 retracement of the impulse is $0.18986. The double top's neckline — the August 30 trough — is $0.18940. They are 4.6 ticks apart, which means the fib, the neckline and the August floor are the same price. Everything above that band is a range; below it, the chart becomes a different market with a measured-move target attached.
Bull path: 0.2098, then the 0.382 that has already said no three times
The first gate is a daily close above the 20-day moving average at $0.20976 — price has closed below it for three straight sessions ($0.20470, $0.20640, $0.20790). Above that stands $0.21480 (the 0.5) and then the real wall: $0.22509 (the 0.382), which the rebound has failed at three times ($0.22530, $0.22640, $0.22720) before the September 8 rejection at $0.23210.
A daily close above $0.23330 confirms the range break and puts the measured move on the table: the $0.18940-$0.23330 range measures $0.04390, and projected from the top it gives $0.27720. That is above the May swing high of $0.26250, so treat $0.25840 and $0.26250 as the realistic first objective and anything beyond as a second leg that needs a catalyst this chart does not currently show. Expect the $0.2321-$0.2333 band to be sold once and $0.2251 to be retested from above before any sustained push — the ATR(14) is $0.01321, or 6.4% of spot, so a routine session covers $0.195-$0.221 without anything structural changing.
Bear path: 0.2004, the 0.189 neckline, and a 0.1455 count
The bear case needs a daily close below $0.20040. That breaks the 0.618, exposes the $0.18986/$0.18940 confluence immediately, and the only meaningful demand underneath is the August 18 low at $0.17120 — the base the entire impulse started from, which is 17% below today's close.
If $0.18940 goes on a closing basis the pattern completes and gets a target. The double top measures $0.23330 − $0.18940 = $0.04390; projected from the neckline that is $0.14550, and the June 25-26 floor at $0.13820-$0.13850 sits 5% below even that objective. The bears cannot reach it without first breaking the August trough, and this market has already shown it can spend three weeks inside a five-cent range while the fib does the work.
Probabilities and the level sheet
The lean is a mild bullish tilt — roughly 55/45 that $0.2098-$0.2148 is traded before $0.18940 — and it rests on September 11 rather than on any indicator. That session wicked to $0.20040 and closed at $0.20640 on 231M ADA, 1.6x the 20-day average: buying at the 0.618, not selling. Against that, the sequence of highs is still descending ($0.25840 to $0.23210), RSI(14) at 51.4 is dead neutral, and ADA is -4.8% over seven sessions while still +13.9% over thirty. This is a market digesting an August impulse: price is 0.9% below its 20-day average at $0.20976 and 6.4% above its 50-day at $0.19546.
Support: $0.20451 (the 0.618), $0.20040 (September 11 low), $0.18986/$0.18940 (0.786 fib and the August 30 neckline), $0.17120 (the August 18 base where the impulse started). Resistance: $0.20976 (20-day SMA), $0.21480 (0.5 fib), $0.22310 (September 9 high), $0.22509 (0.382 fib and the three-touch ceiling), $0.22720-$0.23330 (the supply cluster and the double top), $0.25840 (August 22 blow-off), $0.26250 (window high). Invalidations: the bull case dies on a daily close below $0.20040; the bear case dies on a daily close above $0.23330.
Watch the live order flow on Binance, the latest market data on CoinGecko, and the full interactive chart on TradingView.
ADA's last three weeks fit inside the fib of its own August impulse — 0.382 as the ceiling, 0.618 as the floor — and the 0.786 lands 4.6 ticks from the double-top neckline. Until one of those two edges prints, this is a range, not a trend.
Written by
EarnCrypto.dev Editorial
The EarnCrypto.dev editorial team researches and reviews AI mining platforms, pools and earning tools — publishing only what passes our own checks.
Related reading

SOL Daily Analysis — Three Touches Under the $120.00 Round Number: The 114.29 Retrace Decides 126.56 or 105.05
Solana has been rejected at the $120.00 round number three sessions in a row after a 25% week. The $114.29 retrace decides whether 126.56 or 105.05 comes next.

BTC Daily Analysis — The 82,300 Box Broke: The 87,396 Double Touch Decides 90,776 or 82,648
Bitcoin broke its five-week $82,300 box on 21 September and has coiled under $87,396 since. The $84,463 retrace decides whether 90,776 or 82,648 comes next.

BNB Daily Analysis — The $780.64 Ceiling Broke: The 782.98 Retrace Decides 858 or 741
BNB cleared the $780.64 ceiling that had held since September 5 and reversed to 782.75 today, two ticks off the 782.98 retracement. The measured move is 858.