
XRP Weekly Analysis — Five Lower Highs on Falling Volume and Three Weekly Lows Bought at the 0.618: The 1.2588 Line Decides 1.6581 or 1.1389
XRP weekly: five lower highs on falling volume and three weekly lows bought inside 42 ticks of the 0.618. 1.2588 holds 1.6581; lose 1.2468 and 1.1389 opens.
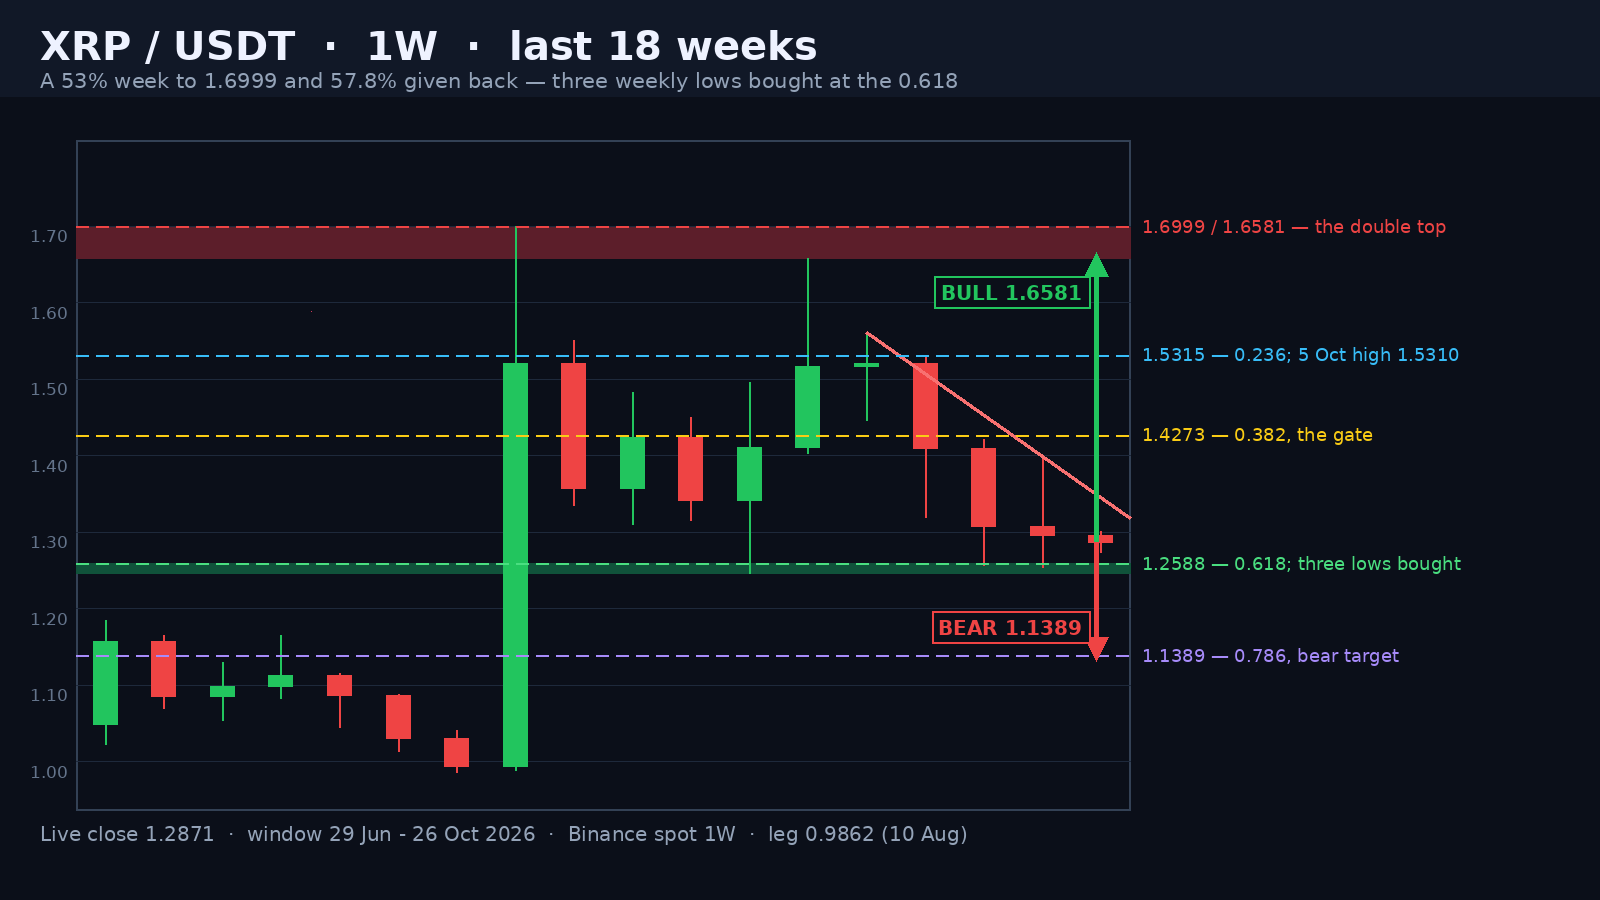
XRP printed its biggest week of 2026 on 17 August: open 0.9935, low 0.9882, high 1.6999, close 1.5204 — a 53.02% expansion on 1.94 billion XRP, which is 2.62 times the twenty-week average. From the 10 August low of 0.9862 that was a 72.4% advance in a single week. Ten weeks later the market is at 1.2865, and 57.9% of the 0.7137-point leg has been handed back.
Five Lower Highs and Four Weeks of Falling Volume
The sequence after the 21 September high is unbroken. Week highs: 1.6581 on 21 September, then 1.5617, 1.5310, 1.4214, 1.3992, and 1.3006 on the week that is still open — five consecutive lower weekly highs. Closes tell the same story with one nuance: 1.5206, 1.4103, 1.3071, 1.2962 and 1.2865 are four lower closes, but the last two sit 0.0097 apart, 0.75% of price, and this week's low at 1.2733 is the first higher weekly low since the top.
Advertisement
Volume has fallen every week of the decline. The week of the high traded 1.73 billion XRP (2.33x the twenty-week average). Then 954 million (1.28x), 691 million (0.93x), 662 million (0.89x) and 550 million (0.74x) — four straight declines, and the last one is 0.32x the week that made the high. A 15.4% slide on shrinking size is not distribution being unloaded; it is an offered market with fewer and fewer sellers left to hit.
Three Weekly Lows Under the 0.618, Not One Close Below It
The 0.618 retracement of the 0.9862-1.6999 leg is 1.25883. Three consecutive weekly lows have gone through it: 1.2468 in the week of 14 September (0.0120, or 0.95%, through the line), 1.2562 in the week of 12 October (0.0026 through) and 1.2546 last week (0.0042 through). Each one closed back above: 1.4105, 1.3071 and 1.2962 — respectively 13.1%, 4.1% and 3.3% above its own low.
Advertisement
Eleven weekly closes in a row have now printed above 1.2588. The last close below it was 10 August, at 0.9936, on the candle immediately before the explosion. That is not proof the line holds forever. It is proof that the market has treated it as a floor, and that nobody who bought the August leg has been forced out on a weekly close.
The 20-Week Mean Is 0.0024 Under the 0.618
Three separate measures land inside a 42-tick band. The 0.618 is 1.25883. The twenty-week average is 1.256435, which is 0.0024 — 0.19% — beneath it. And the two weekly lows that defended the line, 1.2562 and 1.2546, sit on the average. The band is 1.2546 to 1.2588, 0.33% wide, and price closed 2.20% above the top of it.
The fifty-week average sits at 1.452878, 12.9% above spot. XRP has closed above it twice, in the weeks of 21 and 28 September, and both closes were rejected within a month. That is the difference between a bounce inside a bear market and a trend change, and it is not a detail: the 20-week mean supporting price while the 50-week mean caps it is the definition of a market that has stopped falling but has not turned.
What a Weekly Close Under 1.2468 Would Arm
The floor under this whole structure is 1.2468, the 14 September sweep, and it is the flat side of a descending triangle whose lid has come down from 1.6581 to 1.3992 in four weeks while the floor moved 0.0078 in five. The height at the start of the pattern is 1.6999 minus 1.2468, which is 0.4531, projecting 0.7937 — 38% below spot — on a weekly close under the floor.
I will not sell 0.7937 as a target. It requires the whole August advance, the June base and the 2026 low to fail in sequence, and the market rarely pays the full count on a pattern this wide. What the count is good for is the order of the ladder underneath. A weekly close under 1.2468 opens 1.1389 (the 0.786) first, then the February 2026 low at 1.1172, then the 1.05-0.9862 zone where the August leg started. Those are the trades, not the 0.79 handle.
A 53% week, five lower highs on falling volume, and three weekly lows bought inside 42 ticks of the 0.618. XRP has given back 57.9% of its only impulse of the year and has not closed below any part of it — which is what makes this a decision rather than a verdict.
The Bull Case Is 1.4273
The reclaim is a ladder, not a number. First 1.3992, the 19 October high, which is 8.7% above spot. Then 1.4273, the 0.382 that has already rejected two consecutive weekly highs from underneath. A weekly close over it ends the sequence of lower highs and puts 1.5315 in play — the 0.236 that the 5 October week missed by five ticks. Above that, the supply that matters is 1.6581 and then 1.6999, and only a close over 1.6999 cancels the retracement entirely.
The shorter-term argument for the bulls is not the fib, it is the tape: the last two weekly closes are 0.75% apart, the weekly low has turned up, and four consecutive weeks of shrinking volume into a 0.618 means the sellers have run out of size rather than out of intent. That usually produces a bounce before the line is truly tested.
Where the Edge Is
I lean bullish at roughly 55/45, and the entire edge is the 1.2546-1.2588 band. Hold it on a weekly close and the path of least resistance is a retest of 1.3992-1.4273, which is where the next real decision sits. A weekly close under 1.2588 is the warning, a close under 1.2468 arms the count and makes 1.1389 the objective. On the other side, 1.4273 ends the bear case for the medium term.
What keeps this from being a stronger call is the volume at the top: 2.33x average into a high that was 2.46% below the first one. Supply that heavy does not get absorbed without a fight, and the last four weeks are what a fight looks like when the aggressor has stopped pushing. Both readings are live, which is exactly why the band matters more than the opinion.
Written by
EarnCrypto.dev Editorial
The EarnCrypto.dev editorial team researches and reviews AI mining platforms, pools and earning tools — publishing only what passes our own checks.
Related reading
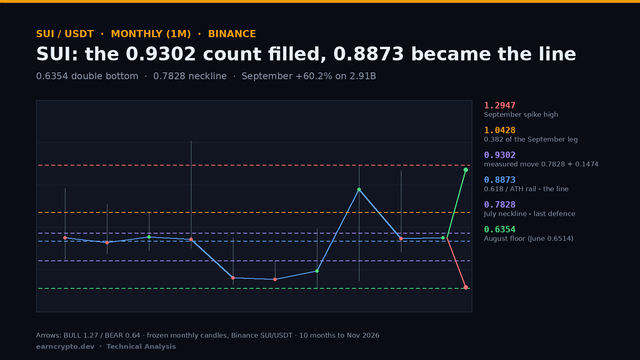
SUI Monthly Analysis — A 0.6354 Double Bottom Filled Its 0.9302 Count: The 0.8873 Retrace Decides 1.0428 or 0.7828
SUI filled the 0.9302 count of its 0.6354 double bottom at September's high and gave 22.8% back in October. The 0.8873 retrace now decides 1.0428 or 0.7828.
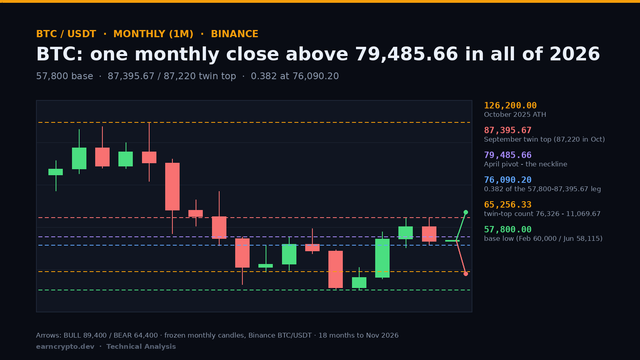
BTC Monthly Analysis — A Single 2026 Close Above 79,485.66 and an 87,395.67 Twin Top: 76,090 Decides 89,400 or 65,256
BTC closed October at 77,582, -7.2% under its open and back below the 79,485.66 pivot. The 76,090.20 retrace now decides whether 89,400 or 65,256 comes first.
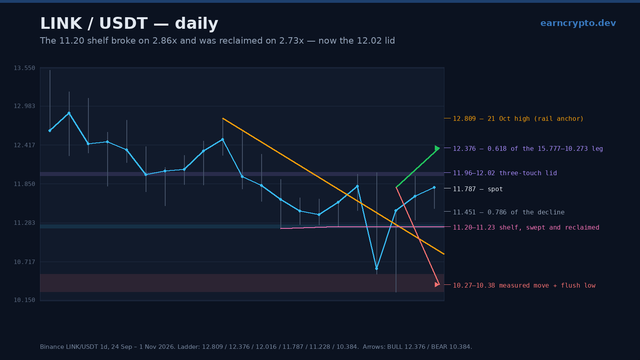
LINK Daily Analysis — The 11.20 Shelf Broke on 2.86x and Was Reclaimed on 2.73x: The 12.02 Lid Decides 12.38 or 10.38
Chainlink swept the 11.20 shelf on 2.86x volume, reversed the whole break on 2.73x and now fights a three-touch 11.96-12.02 lid. 12.02 decides 12.38 or 10.38.