
XRP Daily Analysis — Three Sessions, Six Ticks: A 1.2423 Floor at the 0.618, and 1.2646 Decides 1.2982 or 1.1389
XRP has held a flat 1.2423 floor for three sessions on a quarter of normal volume, right at the 0.618 of its August advance. 1.2646 decides 1.2982 or 1.1389.
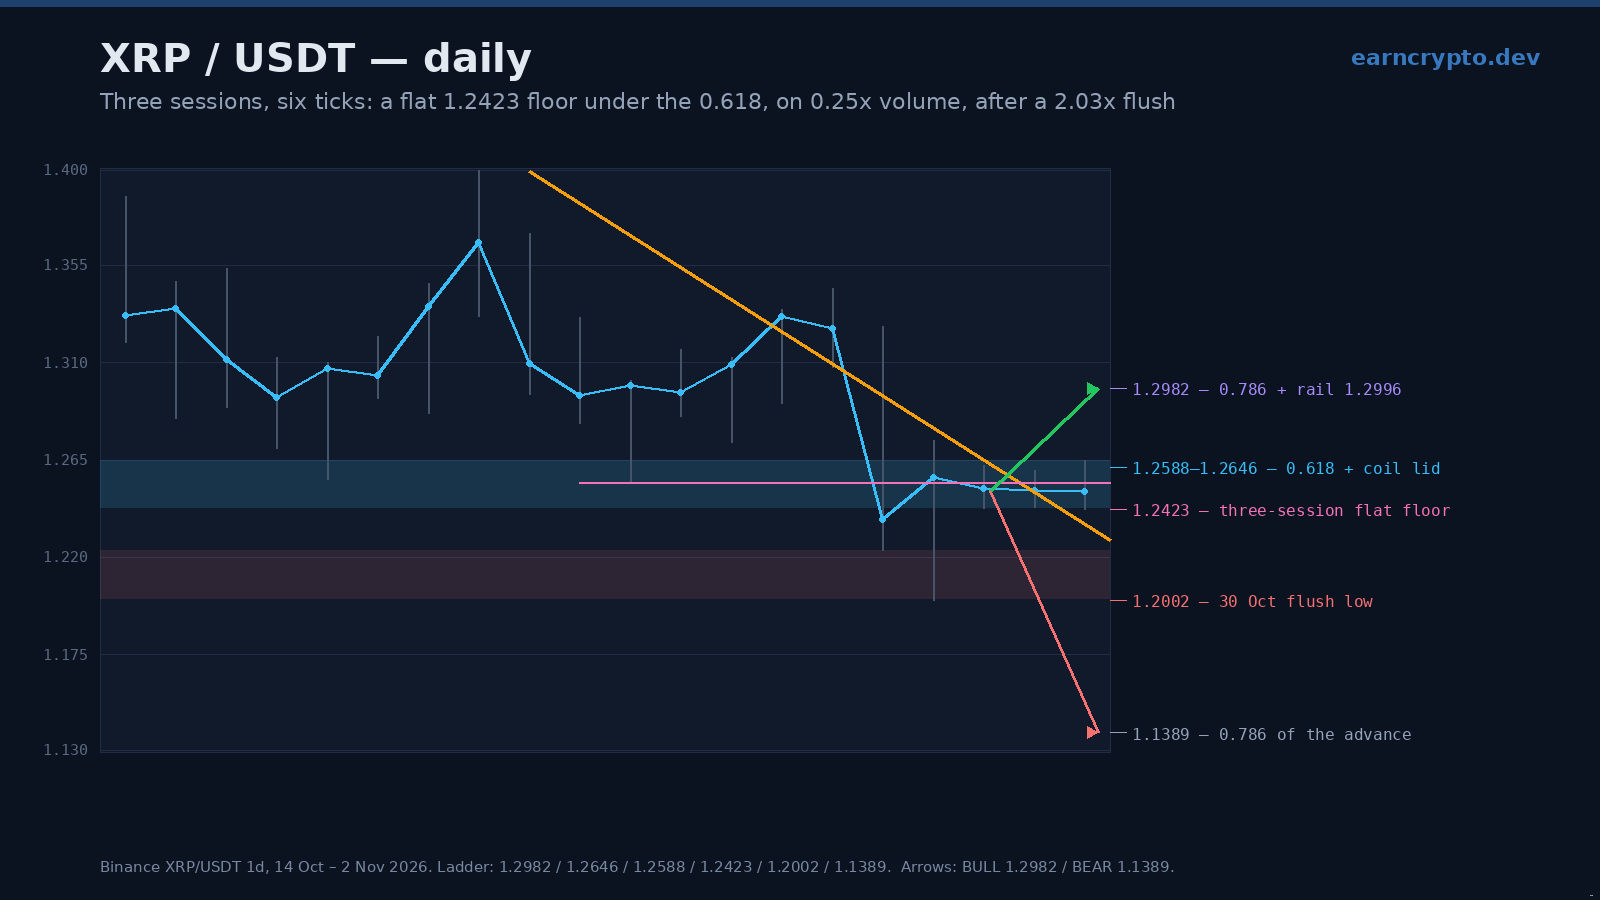
XRP closed at 1.2502 on a Monday session that has traded 1.2423 to 1.2646 on 20.9 million tokens — a quarter of the twenty-day pace — and that is the third session in a row inside a range narrower than two percent. The pair is not drifting. It is coiling on a level that matters.
The level is the 61.8% retracement of the 72.4% August advance from 0.9862 to 1.6999. It sits at 1.2588, and spot is 0.69% under it, with the last three sessions all having traded above it without a close on any of them. Underneath, a floor at 1.2423 has now been touched three sessions running.
Advertisement
Three sessions, six ticks, one floor
The floor is as flat as these things get. Lows of 1.2424 on 31 October, 1.2429 on 1 November and 1.2423 today sit inside a 0.0006 band — six ticks on a four-decimal pair — and none of the three sessions closed under 1.2502. That is buyers arriving at the same price three days in a row, not a coincidence of ranges.
The lid is tighter still in character if not in price: highs of 1.2623, 1.2600 and 1.2646 inside a 0.0046 band. The coil is therefore 0.0223 tall — 1.78% of spot — against an ATR(14) of 0.0489, which is 3.91% of spot. The market is trading at less than half its own average range, three sessions after a session that moved 8.37%.
Advertisement
Volume tells the same story from the other side. The 31 October session traded 22.2 million tokens (0.25x its twenty-session average), 1 November 30.0 million (0.35x) and today is running at 20.9 million, a 0.25x pace against 83.5 million. After a liquidation, volume that dries up this fast means the sellers have stopped pressing.
The three closes are worth naming precisely: 1.2519, 1.2507 and 1.2502. All three inside 0.0017, which is twelve ticks. A market that closes a week inside a dozen ticks at a major fibonacci level is not undecided about the level — it is waiting for one side to blink.
The flush that created it: 2.03x and a 4.7% close off the low
Nothing about this coil makes sense without 29 October. That session opened at 1.3260, tagged 1.3269 and sold to 1.2233 before settling at 1.2377 — 6.66% under the open, an 8.37% range, on 162.8 million tokens. Volume was 2.03 times the average of the twenty sessions before it and the heaviest print since 8 October's 183.0 million.
The next session refused to follow through, and that is the important part. It opened at 1.2376, printed 1.2002 — the lowest price since 20 August — and closed at 1.2567, 4.71% above its own low. A 1.40x session that ends near its high after taking out the prior day's low is a sweep, not a breakdown, and the three sessions since have done nothing to contradict that.
From the 23 September high of 1.6581 to that 1.2002 low the pair has given back 27.62%. The 0.786 rung of that decline is 1.2982, and the two-anchor descending ceiling drawn from 1.6581 through 28 October's 1.3444 lower high — a line no high in forty sessions has closed above — projects 1.2996 for today. Two independent measures, 1.2982 and 1.2996, land within 0.0014 of each other. That is the gate.
Why 1.2982 is not a round-number guess
The confluence is arithmetic, not opinion. The 0.786 retracement of the 1.6581 to 1.2002 decline is 1.2982, and the ceiling rail reads 1.2996 for today. They are the same line for one day only: the rail loses 0.0090 a session, so by Friday it reads 1.2637 and the gate gets cheaper to reach. A confluence that decays is a confluence that favours the seller who waits, which is the argument for a resolution this week rather than next. Above it the next structure is 17 October's 1.3126 high.
The coil's own count is the shorter path. Its height of 0.0223 projected up from 1.2646 gives 1.2869 and projected down from 1.2423 gives 1.2200. The upside count stops short of the gate, which is why 1.2646 has to break first and 1.2982 has to be closed over second — those are two separate events and the market has not done either.
Below, the coil count at 1.2200 is the first destination, then Friday's 1.2002. The 0.786 rung of the whole advance is 1.1389 and that is the number the bear case is actually aiming at; between 1.2002 and 1.1389 there is no structure on this window at all, which is what makes a clean break of 1.2002 expensive rather than merely disappointing.
What invalidates each side
The bull read dies on a daily close under 1.2423. Not a wick — a close — because the level has already absorbed three sessions of probing, and a fourth that closes beneath it would mean the buyers who defended it have been filled and are no longer bidding. That opens 1.2200 immediately and 1.2002 within a session or two.
The bear read dies on a daily close over 1.2646, and properly dies on a close over 30 October's 1.2739. The rail sits 0.0494 above spot, so a close over the lid leaves room to run before the gate, and the 20-day at 1.2999 and the 50-day at 1.3892 sit 4.0% and 11.1% above — both of them are inside the bear's own territory, which is why a first touch of 1.2982 should be expected to reject even in the bullish path.
Three closes inside twelve ticks on a quarter of normal volume, at the 61.8% of a 72% advance, is a market holding its breath. The trend since 23 September is down, so I lean 55/45 to the floor giving way — but the level is too important to short blind, and only a close under 1.2423 pays.
Practically: the coil is 1.78% wide, so anything inside it is noise and both stop levels are close enough to define risk precisely. What I would not do is treat the 1.2002 sweep as a bottom on its own — it was bought, but it has not been retested, and a retest that holds above 1.2423 would be the first constructive print since 23 September.
Chart: XRP/USDT on Binance · Data: XRP on CoinGecko · Reference grid: BINANCE:XRPUSDT on TradingView. Every level is drawn on the frozen 120-session window; no line in this article is an estimate.
Written by
EarnCrypto.dev Editorial
The EarnCrypto.dev editorial team researches and reviews AI mining platforms, pools and earning tools — publishing only what passes our own checks.
Related reading
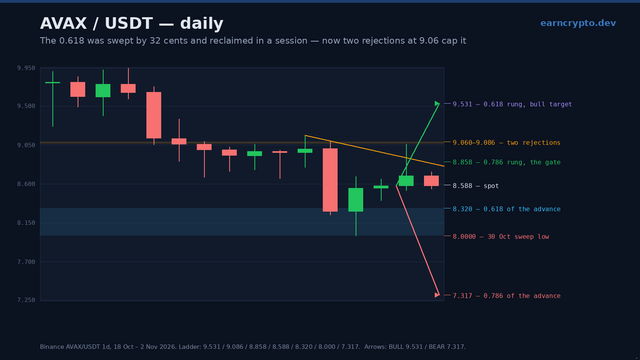
AVAX Daily Analysis — The 0.618 Was Swept by 32 Cents and Reclaimed in One Session: 8.858 Decides 9.531 or 7.317
AVAX swept the 0.618 at 8.320 by 32 cents on 30 October and closed back above it, but two rejections at 9.06 cap the bounce. 8.858 decides 9.531 or 7.317.
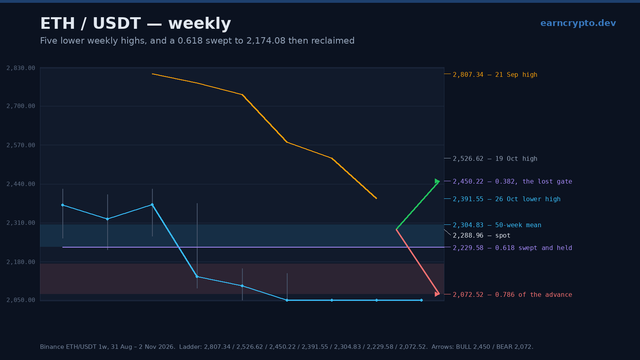
ETH Weekly Analysis — Five Lower Weekly Highs and a 0.618 Swept to 2,174.08: 2,391.55 Decides 2,450 or 2,072
Ethereum has printed five lower weekly highs and swept the 0.618 at 2,229.58 to 2,174.08 before closing back above it. 2,391.55 now decides 2,450 or 2,072.
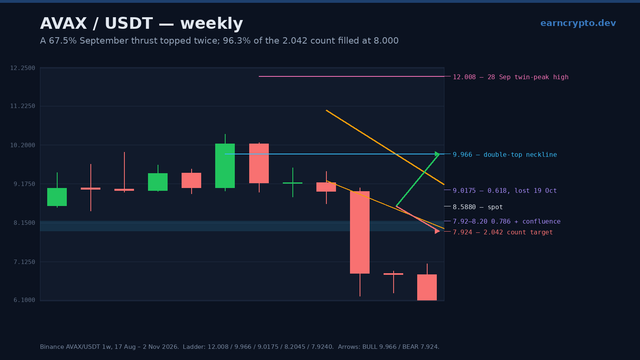
AVAX Weekly Analysis — A 67.5% September Thrust Topped Twice and Filled 96.3% of Its 2.042 Count: 8.2045 Decides 9.966 or 7.924
AVAX gave back a 67.5% September thrust, filled 96.3% of its 2.042 double-top count at 8.000 and closed back above the 0.786. 8.2045 decides 9.966 or 7.924.