
ETH Weekly Analysis — Five Lower Weekly Highs and a 0.618 Swept to 2,174.08: 2,391.55 Decides 2,450 or 2,072
Ethereum has printed five lower weekly highs and swept the 0.618 at 2,229.58 to 2,174.08 before closing back above it. 2,391.55 now decides 2,450 or 2,072.
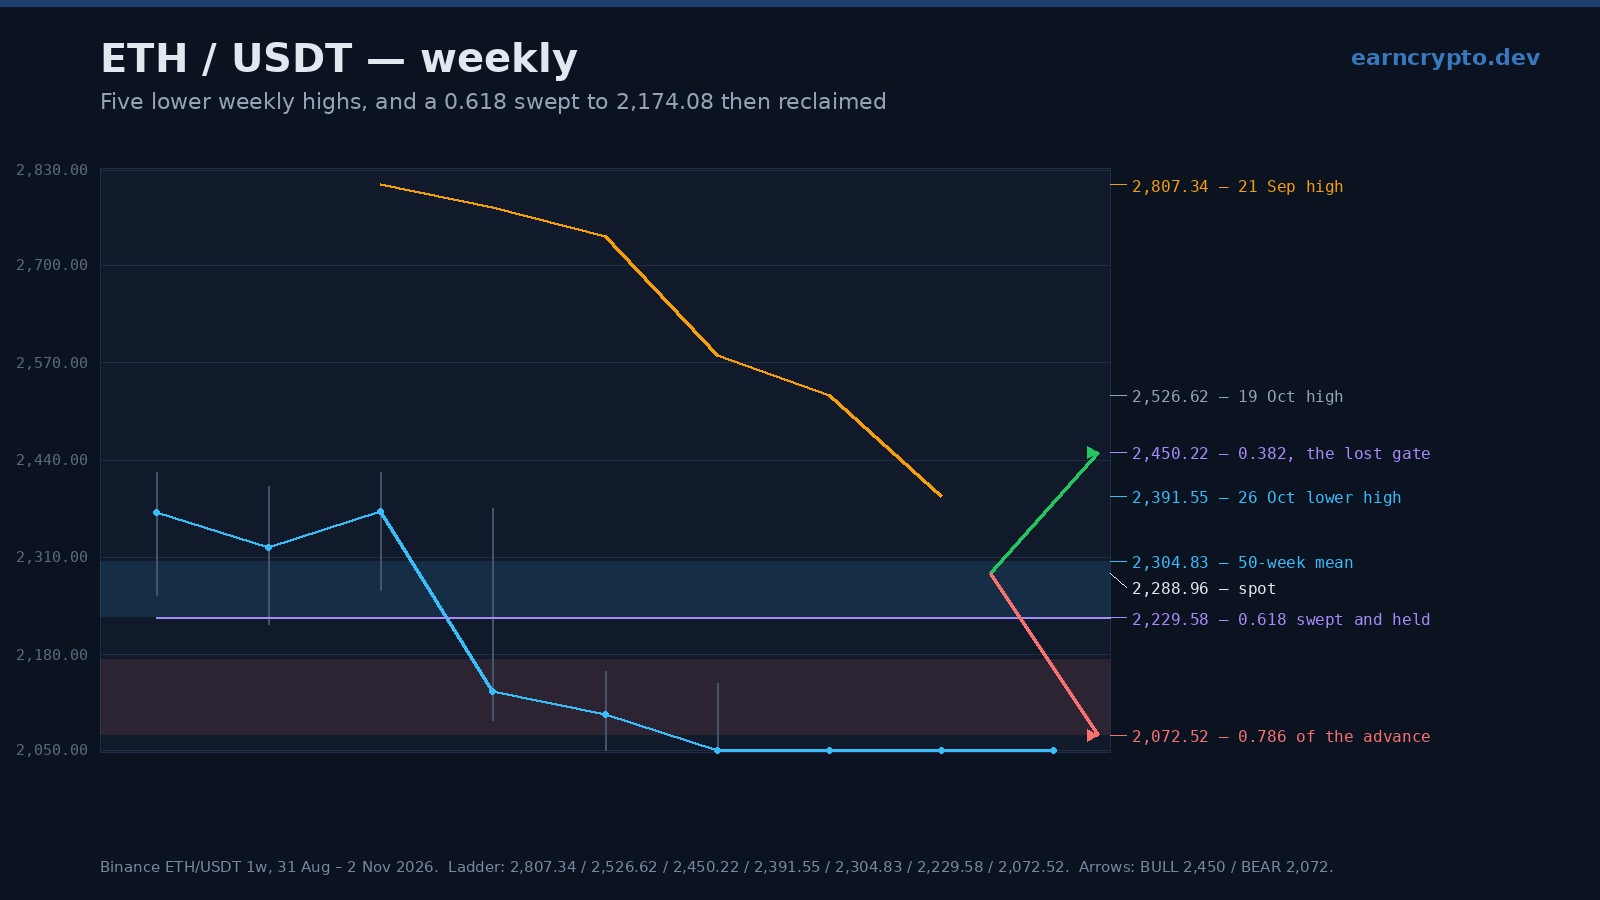
Ethereum settled the week of 26 October at 2,275.31 after a 2,391.55 high and a 2,174.08 low — a 2.34% decline on 1.60 million ETH, 0.86 times the twenty-week average. The low matters more than the close: it took out the 2,229.58 retracement by 55.50 and then closed 45.73 back above it, which makes it the first rung of this decline to be defended on a weekly close after three had been given up.
Our 19 October weekly note put the decision at 2,450.22, with 2,807 above it and 2,229 below. The market took the lower path within two weeks, and the 0.618 that the note named as the destination has now been traded through and reclaimed — so the question has moved from where the decline stops to whether the reclaim holds.
Advertisement
Five lower weekly highs after a 49.9% advance
The advance that is being unwound ran from 1,872.46 on 17 August to 2,807.34 on 21 September — 934.88, or 49.93% in five weeks, starting with a 31.31% week on 3.37 million ETH (1.77x normal). Since the top, the weekly highs read 2,777.33, 2,738.00, 2,579.88, 2,526.62 and 2,391.55 — five consecutive lower highs, a 415.79 staircase in five weeks.
The lows have stepped down with them: 2,406.11, 2,318.00, 2,282.46 and 2,174.08, four lower weekly lows, on four straight red closes of -6.97%, -4.99%, -3.34% and -2.34%. From the 2,807.34 peak the market has given back 18.95% at the close and 22.56% at the low, which is a correction of just under a quarter of the price on falling volume: the five weeks since the top have run 0.97x, 0.88x, 0.94x, 0.95x and 0.80x normal.
Advertisement
Three rungs lost, one defended
The retracement grid of the August-September advance explains almost every print in the decline. The 0.236 sits at 2,586.71 and the 12 October week stopped 6.83 under it — a near miss on a line nobody had marked yet. The 0.382 at 2,450.22 was the gate our 19 October note named; it broke in the week of 12 October, which closed at 2,410.31, 39.91 below it. The 0.500 at 2,339.90 went the following week, with a close of 2,329.87 — 10.03 through it.
Then came the 0.618. The 26 October week opened at 2,329.86, traded as low as 2,174.08 on 30 October and closed at 2,275.31: 55.50 under the line at the low, 45.73 above it at the close. That single week is why the level is now the article rather than the footnote. The 0.618 held — but the fifty-week mean is what the closes have actually lost: the 19 October week settled 1.62 under its own mean and the 26 October week 39.78 under it. Spot now sits between the two lines, 2.63% above the 0.618 and 0.73% below the current mean at 2,304.81 — a 75.23 band that contains the last three weekly closes.
The volume on the flush was the heaviest of the decline: 30 October traded 463 thousand ETH against 178 thousand on 28 October — 2.60 times the session that preceded it — and 29 October printed 412 thousand. Two capitulation sessions into a 0.618 that then closes above it is the classic shape of a failed breakdown, not a fresh leg lower.
The ceiling that is not a fib level
Above the market sits a resistance cluster that no retracement grid produced. Three weekly highs — 2,546.78, 2,566.53 and 2,546.66 — were printed inside a 19.87 band between 17 August and 31 August, and the 12 October high of 2,579.88 stopped 6.83 under the 0.236 at 2,586.71. That makes 2,546.66 to 2,579.88 the real ceiling of this structure, and it is 11.3% to 12.7% above spot.
The first obstacle is much closer. 2,391.55 is the fifth lower high and the top of the last completed week. Above it, 2,450.22 (the lost 0.382) and 2,526.62 (the 19 October high) sit 76.40 apart — one band, not two levels — and 2,579.88 waits beyond that. A weekly close over 2,391.55 would break the staircase; a close over 2,450.22 would put the market back above the gate it lost three weeks ago.
What each side needs
The bull case is a reclaim with a defined invalidation. 2,391.55 first, then 2,450.22, then 2,546.66 — and the whole structure dies on a weekly close back under the 0.618 at 2,229.58, because that would turn the 26 October reclaim into a one-week fakeout. The measured move is the range of the last completed week: 217.47 from 2,174.08 to 2,391.55, which projects 2,609.02 on a close above the lid and 1,956.61 on a close under the low.
The bear case needs 2,174.08 gone. Under it the 0.786 at 2,072.52 is the next real line — 10.4% below spot — and under that the August thrust base at 1,872.46 is the only structure left inside this window. The honest framing is that a market which swept the 0.618 and closed above it usually needs a second test of the low before it decides, so 2,174.08 is likely to be revisited rather than simply broken.
Five lower highs and four lower lows describe a downtrend, and the 0.618 held on a weekly close. The path of least resistance is a retest of 2,174.08 inside a range whose ceiling is 2,391.55 — and the market resolves from that range, not from this article.
Where the bias sits: roughly 50/50, and deliberately so. The bull evidence is the volume capitulation, the 0.618 reclaim and the fact that the price is 2.99% above its twenty-week mean; the bear evidence is five lower weekly highs, four straight red closes and a fifty-week mean at 2,304.81 that the last two weekly closes have both settled under. RSI(14) at 63.05 and an ATR of 232.79 (10.17% of spot) describe a market with plenty of room in both directions. The one close that changes the read is 2,391.55 to the upside and 2,174.08 to the downside.
Chart: ETH/USDT on Binance · Data: Ethereum on CoinGecko · Reference grid: BINANCE:ETHUSDT on TradingView. Every level is drawn on the frozen 120-week window; no level in this article is an estimate.
Written by
EarnCrypto.dev Editorial
The EarnCrypto.dev editorial team researches and reviews AI mining platforms, pools and earning tools — publishing only what passes our own checks.
Related reading
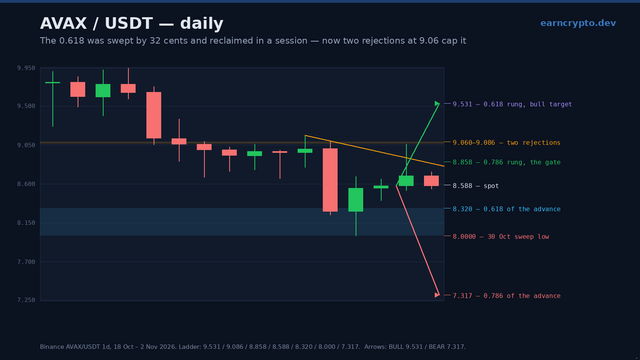
AVAX Daily Analysis — The 0.618 Was Swept by 32 Cents and Reclaimed in One Session: 8.858 Decides 9.531 or 7.317
AVAX swept the 0.618 at 8.320 by 32 cents on 30 October and closed back above it, but two rejections at 9.06 cap the bounce. 8.858 decides 9.531 or 7.317.
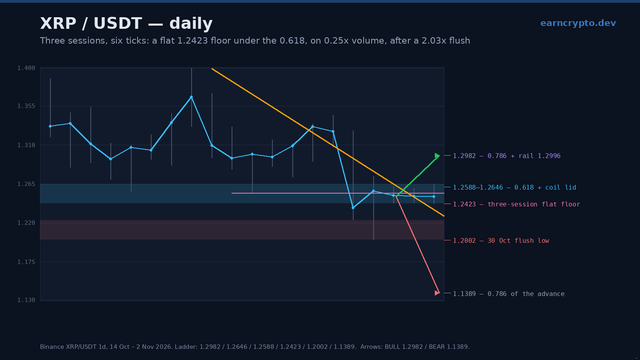
XRP Daily Analysis — Three Sessions, Six Ticks: A 1.2423 Floor at the 0.618, and 1.2646 Decides 1.2982 or 1.1389
XRP has held a flat 1.2423 floor for three sessions on a quarter of normal volume, right at the 0.618 of its August advance. 1.2646 decides 1.2982 or 1.1389.
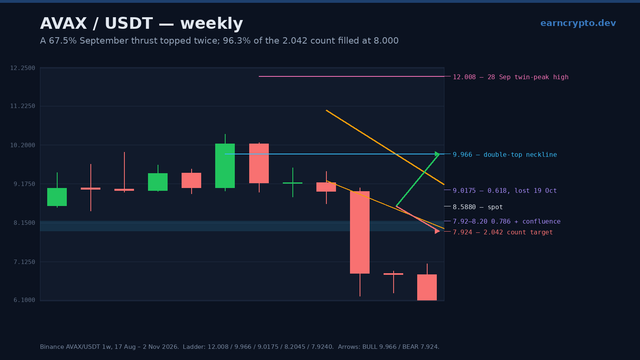
AVAX Weekly Analysis — A 67.5% September Thrust Topped Twice and Filled 96.3% of Its 2.042 Count: 8.2045 Decides 9.966 or 7.924
AVAX gave back a 67.5% September thrust, filled 96.3% of its 2.042 double-top count at 8.000 and closed back above the 0.786. 8.2045 decides 9.966 or 7.924.