
AVAX Weekly Analysis — A 67.5% September Thrust Topped Twice and Filled 96.3% of Its 2.042 Count: 8.2045 Decides 9.966 or 7.924
AVAX gave back a 67.5% September thrust, filled 96.3% of its 2.042 double-top count at 8.000 and closed back above the 0.786. 8.2045 decides 9.966 or 7.924.
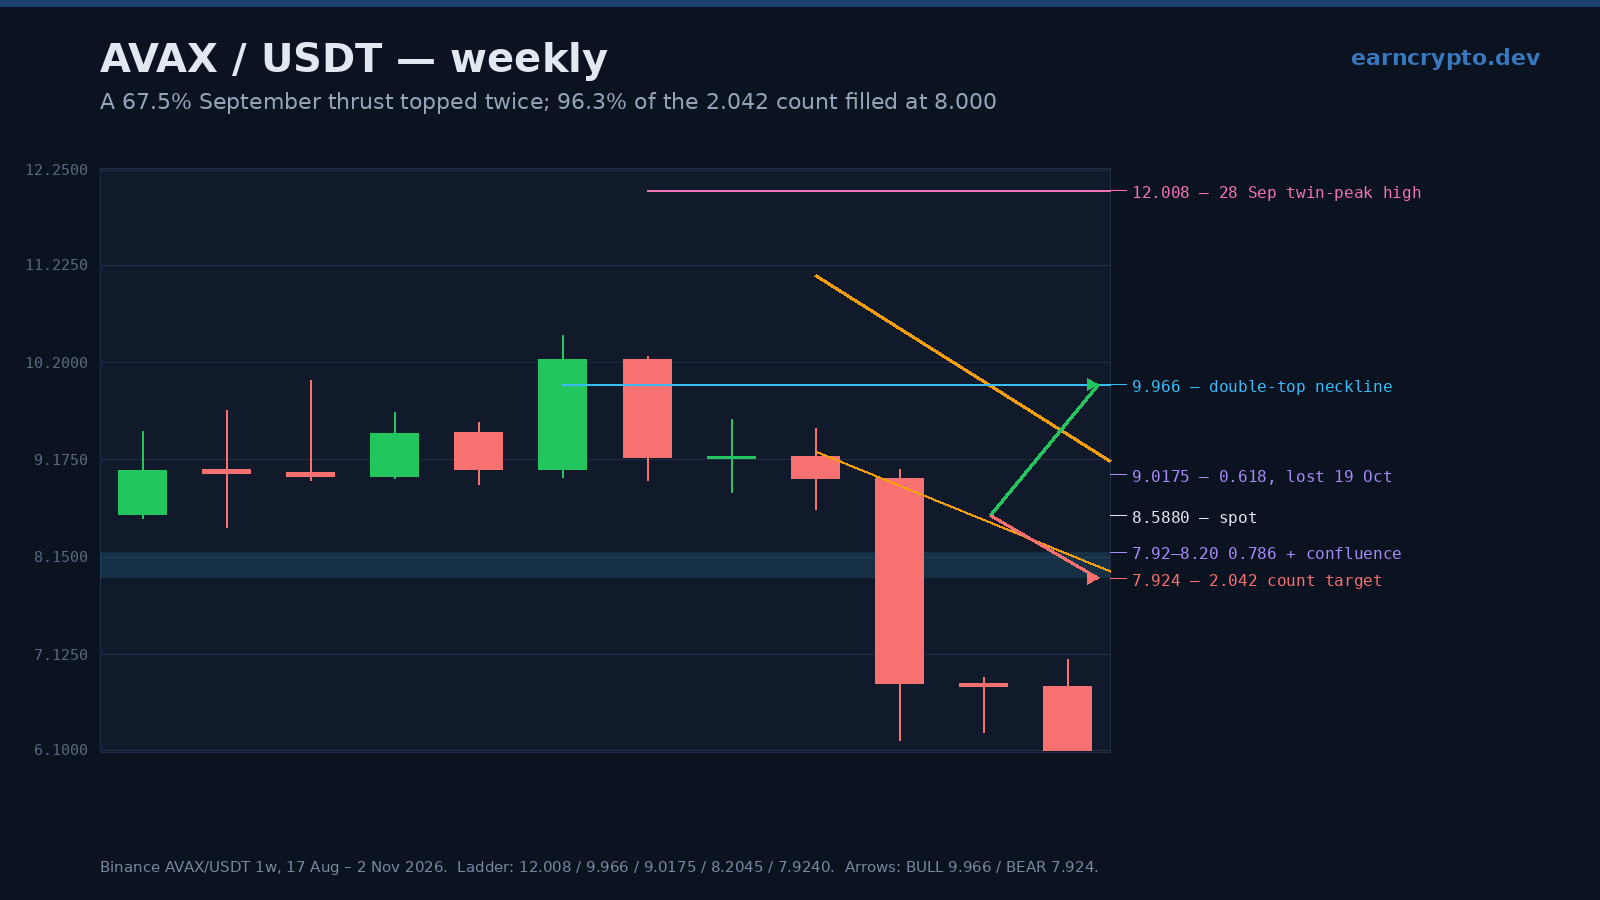
Avalanche closed the week of 26 October at 8.6970 after trading 9.1620 to 8.0000 — a 2.60% decline that left the price 28.53% under the 12.0080 top printed five weeks earlier, and stopped 0.0760 above the measured move that top projected.
Our 12 October weekly note drew the decision at 10.8660 — the 0.236 retracement of the 7.1690 to 12.0080 advance — and said it settled 14.25 or 8.387. The market took the lower path in the following week, and on 30 October it traded 0.3870 through the 8.387 target to exactly 8.000 before closing the week 8.7% above that low.
Advertisement
A 67.5% thrust, then five lower weekly highs
The advance itself is the reason the retracement ladder matters. The week of 14 September opened at 7.2910 and closed at 11.3130 — 55.19% in seven days, on 39.5 million AVAX, 2.59 times the twenty-week average that preceded it. The follow-through week tagged 12.0080 and closed 11.1030, on 37.5 million (2.10x): a 64.7% move from that open to the top in fifteen sessions.
Everything since has stepped down. The weekly highs after the top read 11.7300, 11.1150, 10.0540 and 9.1620 — four consecutively lower prints under the twin peak at 11.7990 and 12.0080 — and the weekly lows read 9.7640, 9.2640, 8.6750 and 8.0000. Four straight red closes (-1.14%, -10.92%, -8.67%, -2.60%) have given back 33.38% from the high, and this week has added a fifth red so far at 8.5820.
Advertisement
Volume is the part that argues against a clean breakdown. The three weeks into the top ran 2.59x, 2.38x and 2.10x normal; the four weeks down have run 1.54x, 0.99x, 0.60x and 0.68x. A 33% decline on 0.6-0.7x volume is an absence of bids, not a distribution campaign — which cuts both ways: it leaves no heavy seller overhead, and it leaves no evidence of accumulation under the market either.
The double top measured 2.042, and 96.3% of it is filled
The pattern is a twin peak, not a single spike. 11.7990 on 21 September and 12.0080 on 28 September sit 0.2090 apart — 1.77% — and the low between them was 9.9660 on the first of those two weeks, which is the neckline. The height from that neckline to the higher peak is 2.0420, and projected down it gives 7.9240.
The break came in the week of 12 October, which closed at 9.7770 — 0.1890 under the neckline, on a 10.92% fall. The two weeks since have filled 96.3% of the count: the 26 October low of 8.0000 missed 7.9240 by 0.0760, which is 0.9% of spot. A measured move that stops eight cents above its target is not a coincidence to trade against — it is a market that has finished the job it set out to do.
Three measurements inside a 0.28 band
Under the price there is a confluence that is unusually tight. The 0.786 of the 7.1690 to 12.0080 advance sits at 8.2045. The twenty-week mean sits at 8.1248. The count target is 7.9240. All three live inside a 0.2805 band — 3.27% of spot — and the 30 October low of 8.000 landed in the middle of it.
That is why 8.000 is the number that matters for the week ahead rather than 8.6970 or the round 8.50. A weekly close under 8.000 would not just break a round number: it would put the market below the 0.786, below its own twenty-week mean and below a completed measured move in the same print, and the next real weekly shelf under it is 7.276 from 7 September and then the thrust base at 7.1690.
Above, the resistance is a staircase with a recent break in it. 9.0175 — the 0.618 — was the line the 19 October week closed 0.0885 under, and it has not been retested since. Above it sit 9.1620, the 26 October high; 9.2640, the 12 October low that becomes resistance once a low breaks; and 9.9660 on the neckline. The channel from the 12 October week compresses 1.8510 to 1.1620 over three weeks — a falling wedge 1.162 wide at 26 October, with the upper rail passing within 0.0845 of the 19 October high and the lower rail within 0.0430 of its low.
What each side needs
The bull case does not need a new high, it needs a weekly close over 9.1620. That would break the four-week sequence of lower highs, put the price back above the 0.618 at 9.0175 and open 9.9660 — the neckline that produced the whole 2.042 count. The measured move out of the wedge, 1.1620 added to the upper rail, projects 10.3240 and would confirm the same thing at a slower pace.
The bear case needs a weekly close under 8.000, and then the arithmetic is short: 7.9240 is the count, 7.276 is the 7 September low, 7.1690 is the base of the entire 67.5% advance. Losing the thrust base would mean the September move was never real, and the 2026 low at 5.681 comes into view for the first time since June.
Four lower highs, four lower lows and a measured move that is 96.3% complete is a decline that has done its work — but a market that has done its work is not the same as a market that has turned. Until a weekly close reclaims 9.1620 the path of least resistance is the confluence at 7.92-8.20, and the burden of proof has shifted to the buyers.
The bias here is roughly 55/45 in favour of a bounce that fails, which is a different thing from a bullish call. The 0.786 was swept and reclaimed on the same week, the count is 96.3% filled, and the week's final session printed a 0.5360 range and closed 8.6970 — buyers are not absent. But the weekly twenty-mean is 5.63% under the price, the fifty-week mean at 9.3067 is 8.44% above it, and RSI(14) at 59.61 with an ATR of 1.4701 (17.1% of spot) describes a market that can still travel a long way in either direction without breaking anything. A weekly close back over 9.0175 is the first evidence that the wedge resolved up; a weekly close under 8.000 is the evidence it resolved down.
Chart: AVAX/USDT on Binance · Data: Avalanche on CoinGecko · Reference grid: BINANCE:AVAXUSDT on TradingView. Every level is drawn on the frozen 120-week window; no level in this article is an estimate.
Written by
EarnCrypto.dev Editorial
The EarnCrypto.dev editorial team researches and reviews AI mining platforms, pools and earning tools — publishing only what passes our own checks.
Related reading
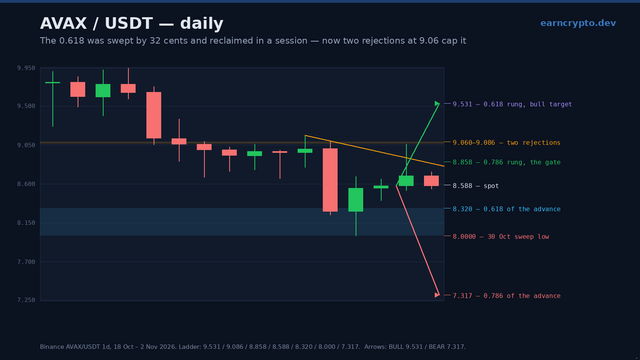
AVAX Daily Analysis — The 0.618 Was Swept by 32 Cents and Reclaimed in One Session: 8.858 Decides 9.531 or 7.317
AVAX swept the 0.618 at 8.320 by 32 cents on 30 October and closed back above it, but two rejections at 9.06 cap the bounce. 8.858 decides 9.531 or 7.317.
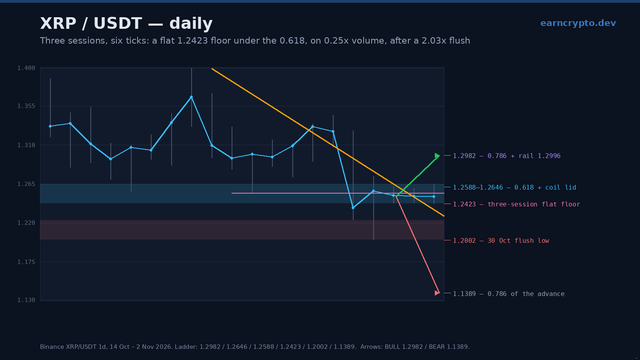
XRP Daily Analysis — Three Sessions, Six Ticks: A 1.2423 Floor at the 0.618, and 1.2646 Decides 1.2982 or 1.1389
XRP has held a flat 1.2423 floor for three sessions on a quarter of normal volume, right at the 0.618 of its August advance. 1.2646 decides 1.2982 or 1.1389.
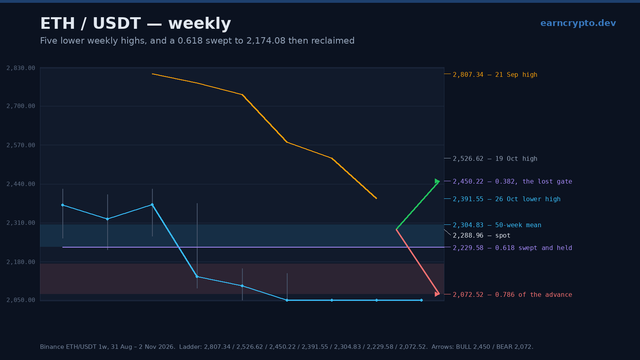
ETH Weekly Analysis — Five Lower Weekly Highs and a 0.618 Swept to 2,174.08: 2,391.55 Decides 2,450 or 2,072
Ethereum has printed five lower weekly highs and swept the 0.618 at 2,229.58 to 2,174.08 before closing back above it. 2,391.55 now decides 2,450 or 2,072.