
AVAX Daily Analysis — The 0.618 Was Swept by 32 Cents and Reclaimed in One Session: 8.858 Decides 9.531 or 7.317
AVAX swept the 0.618 at 8.320 by 32 cents on 30 October and closed back above it, but two rejections at 9.06 cap the bounce. 8.858 decides 9.531 or 7.317.
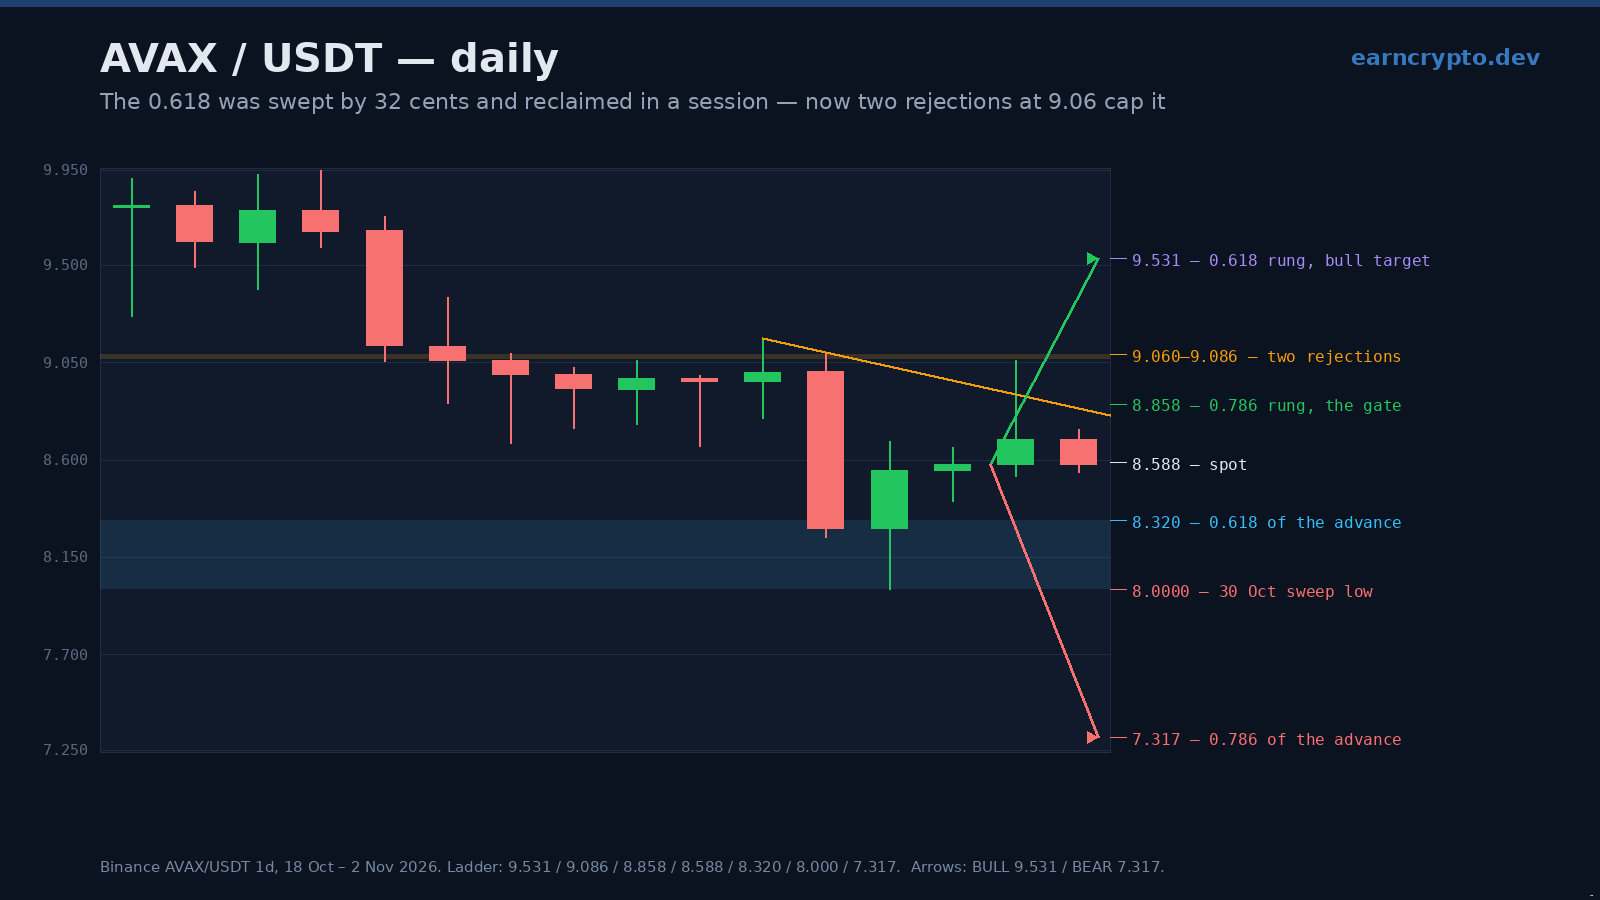
AVAX closed at 8.578 after a session that has traded 8.544 to 8.740 on 0.54 million tokens — a 0.25x pace, the quietest session of the bounce. Four sessions ago the pair was printing 8.000; two sessions ago it was rejecting 9.060. The distance between those two prices is the whole argument.
Our 29 October note put the decision at 8.204, with 9.26 above and 7.92 below. The market took the lower path the same day, printed 8.000 — 0.204 under that gate — and has closed above 8.204 every session since. The bear case was right for one candle.
Advertisement
The 0.618 was swept by 32 cents and reclaimed in a session
The relevant grid is the August-September advance from 6.040 to 12.008 — a 98.8% run. Its 0.618 retracement sits at 8.320. Friday's low of 8.000 went 0.320 under that line and the session closed at 8.553, 6.91% above its own low and 0.233 back above the level.
That is not a coincidence of round numbers. 8.000 is the sort of price a market prints when it is taking stops, and the fact that it stopped exactly there — 0.320 below the 0.618 and nothing more — is the first evidence since 29 September that buyers have a level rather than a hope.
Advertisement
The flush itself was 29 October: opened at 9.007, tagged 9.086, sold to 8.243 and closed at 8.281 — 8.06% under the open, a 10.18% range, on 2.78 million tokens, or 1.29x the twenty-session average. From the 12.008 top the pair has now given back 33.38%.
Two rejections at 9.06
The bounce has a ceiling and it is well documented. 29 October's high was 9.086 — the flush session itself rejected there before selling off. 1 November printed 9.060 and gave back 68% of that session's range, closing at 8.697. Two tests of the same level, 0.026 apart, neither closed above it.
That level is not arbitrary either. The 0.618 rung of the 12.008 to 8.000 grid is 9.531, its 0.5 rung is 10.004, and the two-anchor ceiling from 28 October's 9.162 lower high through Sunday's 9.060 projects 9.035 for today. The 9.06 print is the market's answer to all three.
The first gate is closer: 8.858, the 0.786 rung of the decline grid, sits 3.26% above spot. Until a session closes above it, the bounce is a retracement of a 33.38% decline rather than a reversal of one. The two higher lows since the sweep — 8.407 on 31 October and 8.524 on 1 November, with today's 8.544 — are the constructive part, and they are what keeps 8.000 untested.
The measured move was filled 0.026 short
Between 23 and 28 October the pair held a shelf: six sessions with lows between 8.662 and 8.863, highs up to 9.350. That is 0.688 of height, and projected down from the 8.662 floor it gives 7.974. Friday's 8.000 stopped 0.026 above the count.
So the measured move the breakdown promised was delivered, almost exactly, and bought back on the same candle. Completed counts remove the sellers' next target: with the shelf count filled, the bear case has to argue for a second leg from somewhere new, and the nearest real structure under 8.000 is 7.317 — 14.7% away. A market that has to travel that far to find support is not one where the easy short is still available.
The bear's argument is not dead, though. The 20-day sits at 9.216 and the 50-day at 9.845 — 7.4% and 14.8% above spot — and the last close above the 20-day was 11 October. A bounce that stalls under its own twenty-day average is still a bounce.
What invalidates each side
Below, the bull read dies on a close under 8.407, the first higher low. That reopens 8.320 — the level that was reclaimed — and then 8.000. A close under 8.000 is a different article: it would confirm the 0.618 was not swept but genuinely broken, and it puts 7.317 in play with nothing in between.
Above, the bear read dies on a close over 9.086. That is the two-touch ceiling and it sits 5.9% above spot, so it is a real move rather than a wick. A close over it opens 9.531 and then 10.004, and the 20-day at 9.216 sits between the two — a reclaim of that average would be the first close above it since 11 October.
A 0.618 that is swept by 32 cents and reclaimed the same session is information, and two rejections at 9.06 are the market's reply. The bounce has earned the benefit of the doubt below 8.858 and nothing above it — until one of those two lines closes, this is a range, not a trend.
The probabilities, honestly: the dominant trend is still down and the bounce has not closed over a single moving average, so I give the ceiling a slight edge — call it 55/45 that 8.858 holds on the first test. What would change that is a session that closes over 8.858 on volume above 1.5x; the four full sessions of the bounce printed 1.29x, 1.21x, 0.79x and 1.20x, which is not what a reversal looks like.
Chart: AVAX/USDT on Binance · Data: Avalanche on CoinGecko · Reference grid: BINANCE:AVAXUSDT on TradingView. Every level is drawn on the frozen 120-session window.
Written by
EarnCrypto.dev Editorial
The EarnCrypto.dev editorial team researches and reviews AI mining platforms, pools and earning tools — publishing only what passes our own checks.
Related reading
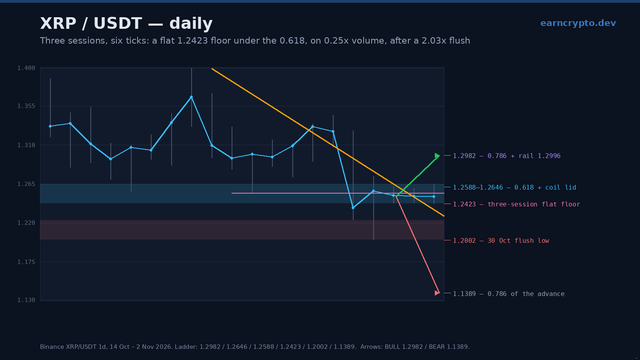
XRP Daily Analysis — Three Sessions, Six Ticks: A 1.2423 Floor at the 0.618, and 1.2646 Decides 1.2982 or 1.1389
XRP has held a flat 1.2423 floor for three sessions on a quarter of normal volume, right at the 0.618 of its August advance. 1.2646 decides 1.2982 or 1.1389.
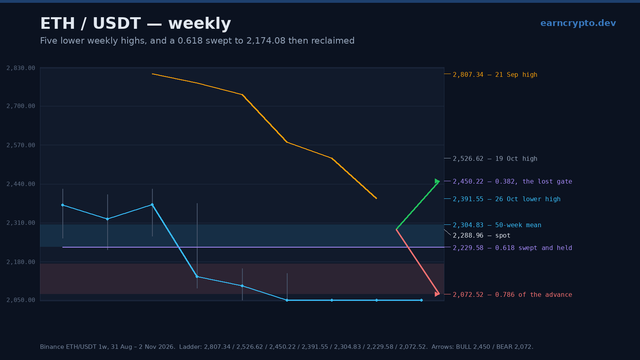
ETH Weekly Analysis — Five Lower Weekly Highs and a 0.618 Swept to 2,174.08: 2,391.55 Decides 2,450 or 2,072
Ethereum has printed five lower weekly highs and swept the 0.618 at 2,229.58 to 2,174.08 before closing back above it. 2,391.55 now decides 2,450 or 2,072.
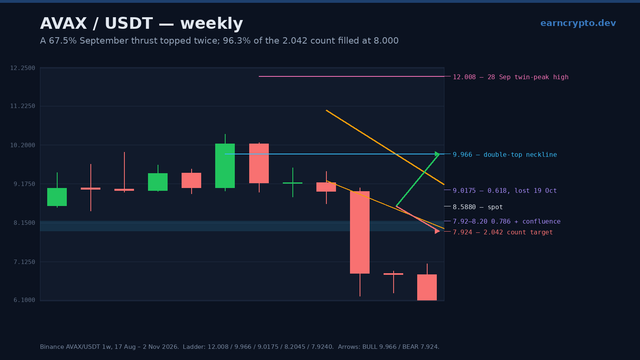
AVAX Weekly Analysis — A 67.5% September Thrust Topped Twice and Filled 96.3% of Its 2.042 Count: 8.2045 Decides 9.966 or 7.924
AVAX gave back a 67.5% September thrust, filled 96.3% of its 2.042 double-top count at 8.000 and closed back above the 0.786. 8.2045 decides 9.966 or 7.924.