
XRP Daily Analysis — A 1.6300 Lower High Over a 1.4458 Wick on the 0.5 Retrace: The 1.4525 Line Decides 1.836 or 1.4039
XRP's 33% September leg topped at 1.6581, put in a 1.6300 lower high and wicked to 1.4458 on Friday. The 1.4525 half-retrace decides 1.8364 or 1.4039.
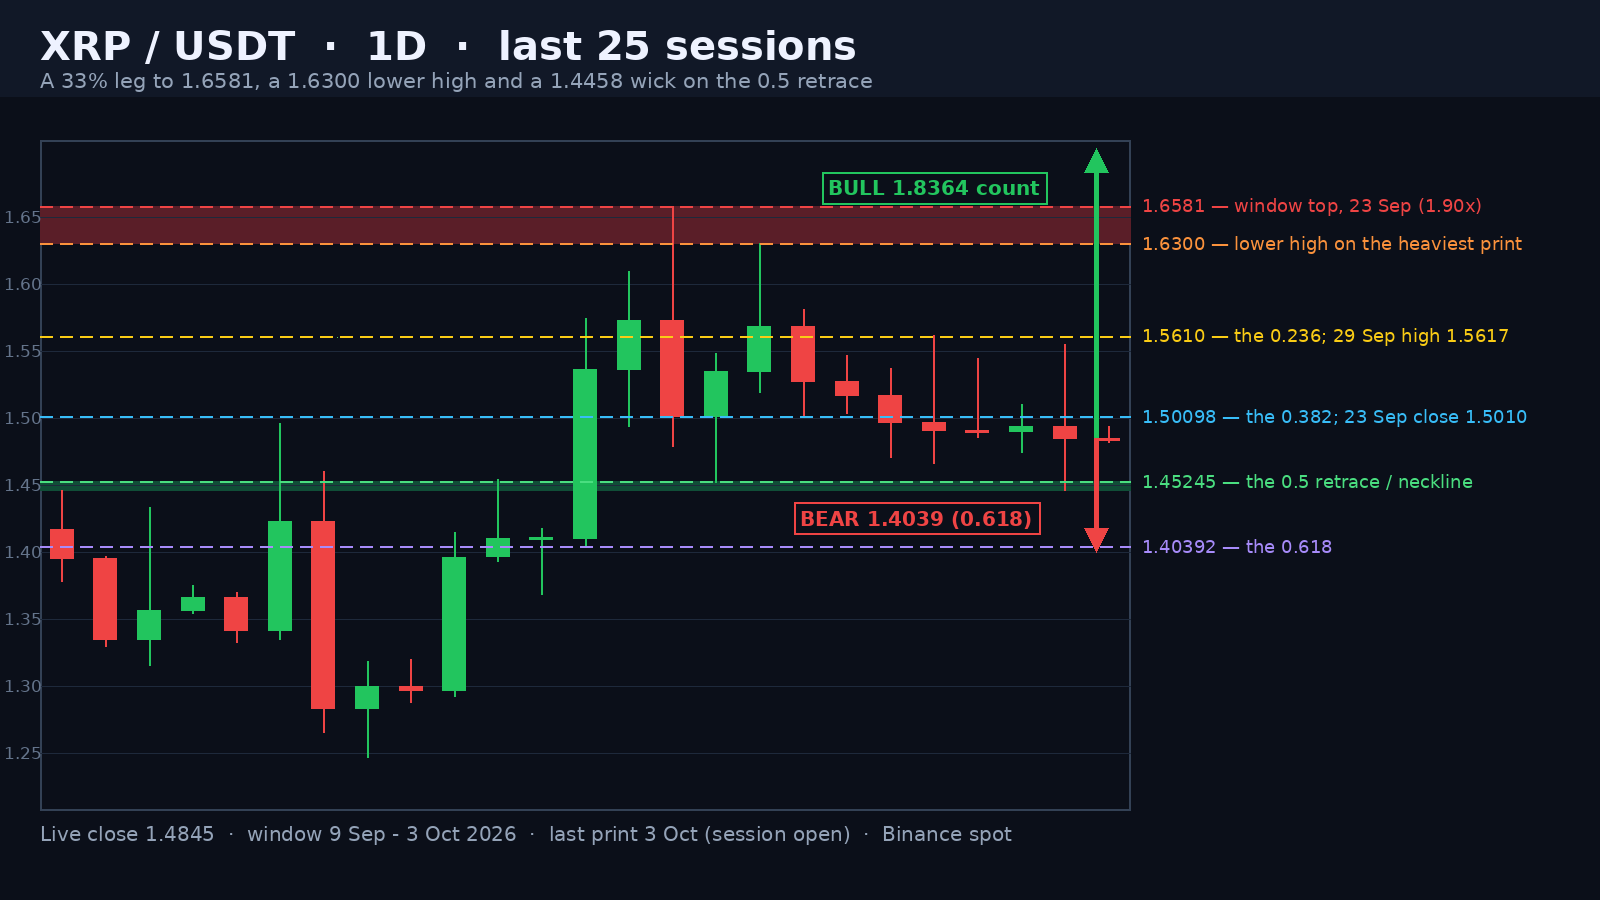
XRP is trading at 1.4841 in the opening hours of the 3 October session, 10.49% under the 1.6581 high of 23 September and 19.0% above the 1.2468 low of 16 September that opened the 33% leg. Today's range is 0.0114 points, 0.77% of spot, on a 0.07x full-day volume pace against the 20-day average of 201.0 million XRP. Spot sits 0.0324 above the 0.5 retracement of that leg at 1.45245 — a level the 2 October session pierced to 1.4458 and gave back the same day — and the 20-day average at 1.4609 is 1.6% under the close.
A 1.6581 Top, a 1.6300 Lower High and the Heaviest Print of the Window
The leg ran 1.2468 on 16 September to 1.6581 on 23 September — 0.4113 points, or 33%, in seven sessions. The top candle opened 1.5727, printed 1.6581 and closed 1.5010 on 318 million XRP, 1.90x its 20-day average, leaving it 9.47% under its own high: the largest rejection in the window. Two sessions later the market tried again and printed exactly 1.6300, 0.0281 under the top, and closed 1.5685 on 342 million XRP, 1.95x — the heaviest single print of the four months. Two failures from the same region with volume rising into the second is distribution, and the pivot between them is the 24 September low at 1.4517. That is the neckline everything here is measured from: 1.6581 minus 1.4517 is 0.2064.
Advertisement
Eight Sessions Traded Between the 0.236 and the 0.5
Since the second top every rally has died above 1.51 and every dip has been bought above 1.44. The closes read 1.5274, 1.5167, 1.4968, 1.4906, 1.4900, 1.4939, 1.4847 and 1.4848 — eight prints inside a 0.0427 band. The highs tell the story better: 1.5810, 1.5464, 1.5368, 1.5617, 1.5443, 1.5103 and 1.5550, a descending sequence whose best effort, the 29 September 1.5617, tagged the 0.236 retracement at 1.56103 to within 0.0007, while the 0.382 at 1.50098 is where the 23 September close landed at 1.5010. Two retracement levels bracketing a two-week range means the market is trading the correction, not the trend, and the volume agrees: six of the seven completed sessions since the second top printed under 1.0x their 20-day average.
The 2 October Wick: 1.4458 and a 2.6% Recovery
Friday is the exception. It opened 1.4940, ran to 1.5550, sold to 1.4458 — 0.0059 through the neckline at 1.4517, the first print under 1.45 since the 21 September 1.4035 low — and closed 1.4847, which is 0.0389, or 2.6%, off the low, on 207 million XRP (1.07x). It is the first test of the 0.5 retrace from above, and the way it was bought matters more than the print: the 1.4458 - 1.5550 range that contained the week is still intact. If a daily close comes under 1.4458, the 0.618 at 1.40392 is 0.0406 lower and the double top's own count — 1.6581 minus the 1.4517 neckline, projected down — fills at 1.2453, just 0.0015 above the 16 September low that started the leg. A count that lands on the origin of the move is the most honest bear target there is.
Advertisement
What Each Side Needs
The bull case is a daily close back over the 0.382 at 1.50098, which puts the 0.236 at 1.56103 back in play — the level that has capped every rally since 25 September. Above it the twin-top trigger is 1.6300: a confirmed break there re-opens the top's count upward, 1.6300 plus 0.2064 giving 1.8364, and through the 1.6581 high itself it becomes 1.8645, with the window's 1.6999 print from 22 August sitting in between as the first gate. RSI is 55.1 and the 20-day average sits 1.6% under spot, so nothing here is stretched.
The bear case starts with the close, not the wick. A daily close under 1.4458 opens the 0.618 at 1.40392 and then the 0.786 at 1.33482, with the 1.2453 count as the destination if the whole September leg unwinds. Between spot and 1.4039 there is almost no structure — the market spent three weeks above 1.44 — so a confirmed break would have air underneath it. The 14-day ATR is 0.0804, 5.41% of spot, which means one average session can cover 1.404 - 1.565: that is why the close under 1.4458, not the wick to it, is the trigger, and why a daily close back over 1.50098 cancels the bear read.
Written by
EarnCrypto.dev Editorial
The EarnCrypto.dev editorial team researches and reviews AI mining platforms, pools and earning tools — publishing only what passes our own checks.
Related reading

SOL Weekly Analysis — A 17-Week Doubling Topped Twice at 124.95 / 123.76: The 116.32 Neckline Decides 124.95 or 100.19
SOL doubled 107.8% in 17 weeks into a 124.95 / 123.76 two-touch top and paid its 108.29 count to 105.71. The 116.32 neckline decides 124.95 or 100.19.

AVAX Weekly Analysis — A 55.2% Thrust and Four 2x-Volume Weeks Under a 12.008 Two-Touch Top: The 10.866 Retrace Decides 14.25 or 8.387
AVAX ran a 55.2% week on 2.27x volume, then coiled four weeks under an 11.799 / 12.008 two-touch top. The 10.866 line decides 14.25 or the 8.387 count.

ETH Daily Analysis — A 2,392.96 Count 94% Filled and Five Rising Lows Back at the 0.382: The 2,635 Line Decides 2,777 or 2,406
ETH's 2,807/2,600 distribution left a 2,392.96 count that went 94% filled at 2,406.11. Five rising lows have retaken the 0.382 — 2,635 decides 2,777 or 2,406.