
TRX Daily Analysis — Six Tests of the 0.3270 Floor Under a 0.3332 Lid: 0.3168 or 0.3474
TRX has printed six sessions of lows inside 0.0017 on the 0.3270 floor while a 0.3332 lid caps every bounce, and the 0.0102 box projects 0.3168 or 0.3474.
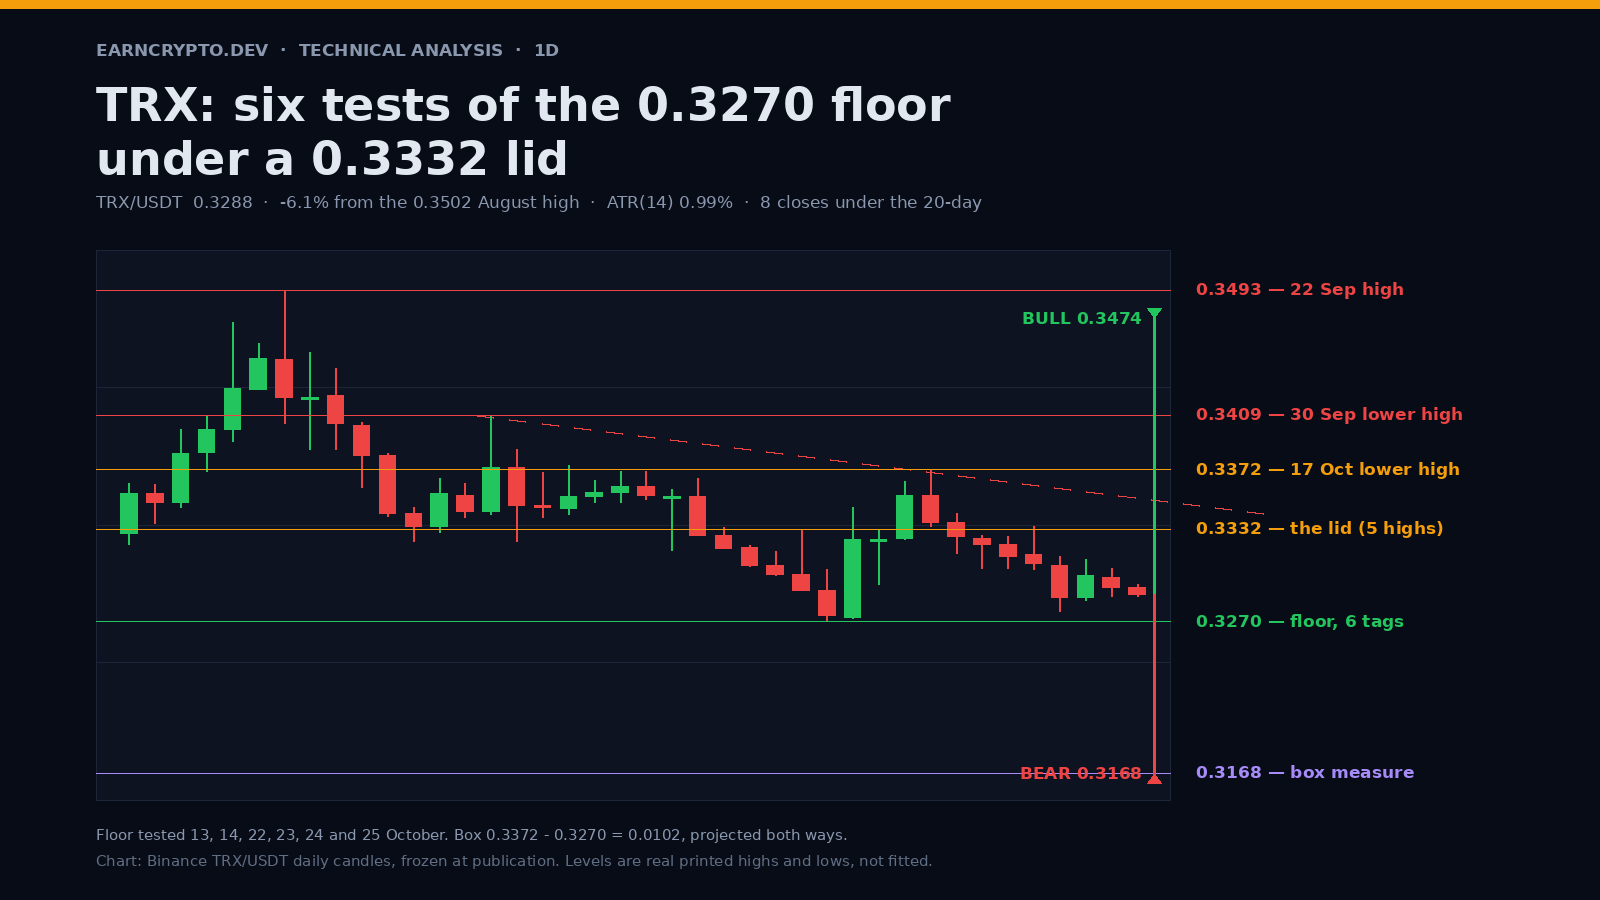
TRX closed Saturday at 0.3293 and is trading at 0.3288 on Sunday, 0.0018 above the 0.3270 low that has now been tested six times in thirteen sessions. That is the whole chart: a horizontal floor, a descending ceiling, and a market that has stopped moving in between.
Since the 0.3493 print on 22 September, TRX has made lower highs at 0.3409 (30 September) and 0.3372 (17 October) while the lows held 0.3270 to 0.3287. The 120-session window high is 0.3502 from 22 August, and at 0.3288 the token is 6.1% under it — the smallest distance from its window high among the twelve names in this scan, against 7.8% for BTC and 29.3% for SUI.
Advertisement
The floor is the whole story
0.3270 was first printed on 13 October (low 0.3270) and again on 14 October (0.3272). The market then spent two sessions bouncing to 0.3372 and three weeks coming back: 0.3277 on 22 October, 0.3284 on 23 October, and 0.3287 on both 24 and 25 October. Six sessions, six lows inside a 0.0017 band — 0.52% of spot. In a market that averaged a 0.986% daily range over the last thirty sessions, that is a floor being defended, not a floor being touched once.
The other side of the account matters just as much. TRX has closed below its own 20-day at 0.33158 for eight consecutive sessions and sits under the 50-day at 0.335152. A floor that keeps being tested from underneath is not a base until the 20-day is reclaimed, and right now the 20-day at 0.33158 is 0.0028 overhead.
Advertisement
The lid at 0.3332 is not a guess
Ten sessions since 6 September have traded through the 0.3328 to 0.3334 band. The highs: 0.3333 on 9 October, 0.3332 on 12 October, 0.3332 on 15 October, 0.3328 on 19 October and 0.3334 on 21 October. The lows: 0.3329 on 6 September, 0.3336 on 17 September, 0.3330 on 28 September, 0.3328 on 8 October and 0.3334 on 17 October. Ten tags on one handle is the pivot the market actually uses, and it is the first thing a bounce has to close above.
Above it sits a heavier shelf at 0.3342 to 0.3352, which has taken eleven tags since 5 September and capped the 14 October reversal candle — a session that printed a 0.3347 high and closed at 0.3325 on 163.9 million TRX, 2.19 times its own trailing twenty-day average.
What the 0.5 retrace said
Measure the down-leg from the 22 September high at 0.3493 to the 13 October low at 0.3270: 0.0223. The 0.236 is 0.33226, the 0.382 is 0.33552, the 0.5 is 0.33815 and the 0.618 is 0.34078. The 17 October bounce topped at 0.3372 — a 45.7% retrace, nine and a half ticks under the 0.5 — and then rolled over into the lower high that has defined the last eight sessions. A rally that dies nine ticks under a 0.5 is a rally the sellers were waiting for.
The two roads from here
Bear: a daily close under 0.3270 breaks a floor with six tags behind it. The box from 0.3372 down to 0.3270 is 0.0102, and projected from the floor that is 0.3168. Under it the window has one more shelf, the 0.3144 low from 1 July, which is also the bottom of the entire 120-session range.
Bull: reclaim 0.3332 first, then the 0.3342 to 0.3352 shelf, then the 0.3372 lower high. Take out 0.3372 and the same 0.0102 box projects 0.3474, with the 0.3493 September high and the 0.3502 August high above that. Neither path is a straight line: the last four sessions have closed inside a 0.0015 band, between 0.3286 and 0.3301.
What invalidates this
A daily close above 0.3372 kills the descending sequence and puts 0.3493 back in play; a close above the 50-day at 0.335152 changes the trend read without breaking the box. On the other side, a close under 0.3270 on volume above 100 million TRX would confirm the break — the five completed floor sessions printed between 44 and 93 million, the exception being 14 October's 163.9 million reversal.
Patience is the trade. ATR(14) is 0.003257, 0.99% of spot and the eighteenth percentile of the last sixty sessions; Sunday's range is 0.0008, 0.243% against a 0.895% ten-day average. Compression this tight resolves, and the only question worth asking is which side of 0.3270 or 0.3332 gets the first daily close.
Written by
EarnCrypto.dev Editorial
The EarnCrypto.dev editorial team researches and reviews AI mining platforms, pools and earning tools — publishing only what passes our own checks.
Related reading
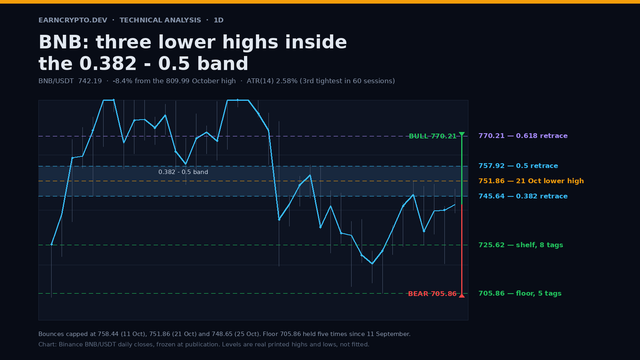
BNB Daily Analysis — A Third Lower High at 748.65 Under the 0.5 at 757.92: 745.64 Decides 770.21 or 705.86
BNB has made three lower highs — 758.44, 751.86 and 748.65 — inside the 0.382 to 0.5 band of the October slide, and 745.64 decides between 770.21 and 705.86.
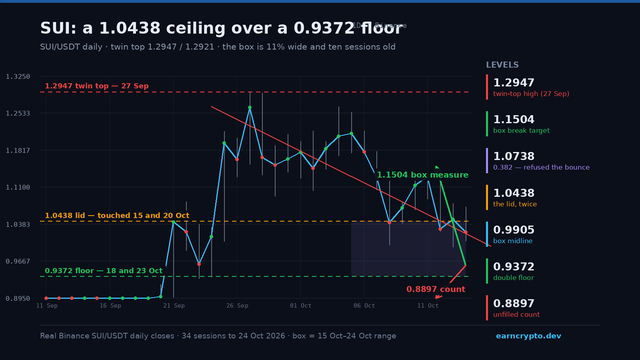
SUI Daily Analysis — A Twin Top at 1.2947 and a Ten-Session Box: The 0.9372 Floor Decides 1.1504 or 0.8897
SUI's 27.6% slide stopped twice at 0.9372 and the lid twice at 1.0438. The box has held for ten sessions and is 11.1% wide — here is where a break pays out.
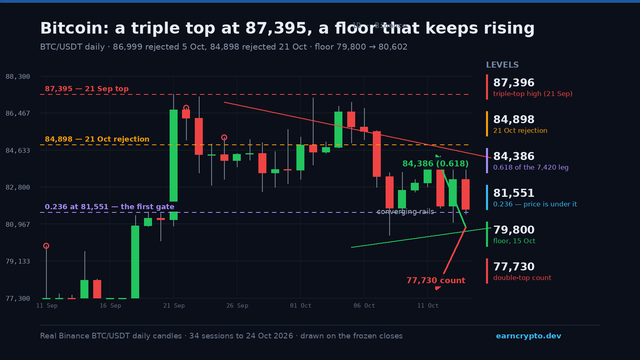
BTC Daily Analysis — A Triple Top at 87,395 Squeezed Into a 3,902-Point Triangle: 81,551.12 Decides 84,385.56 or 77,730.33
Bitcoin failed at 87,000 three times and held 79,800 four. Price sits 695 under the 0.236 at 81,551 inside a converging triangle — here is the daily map.