
BNB Daily Analysis — A Third Lower High at 748.65 Under the 0.5 at 757.92: 745.64 Decides 770.21 or 705.86
BNB has made three lower highs — 758.44, 751.86 and 748.65 — inside the 0.382 to 0.5 band of the October slide, and 745.64 decides between 770.21 and 705.86.
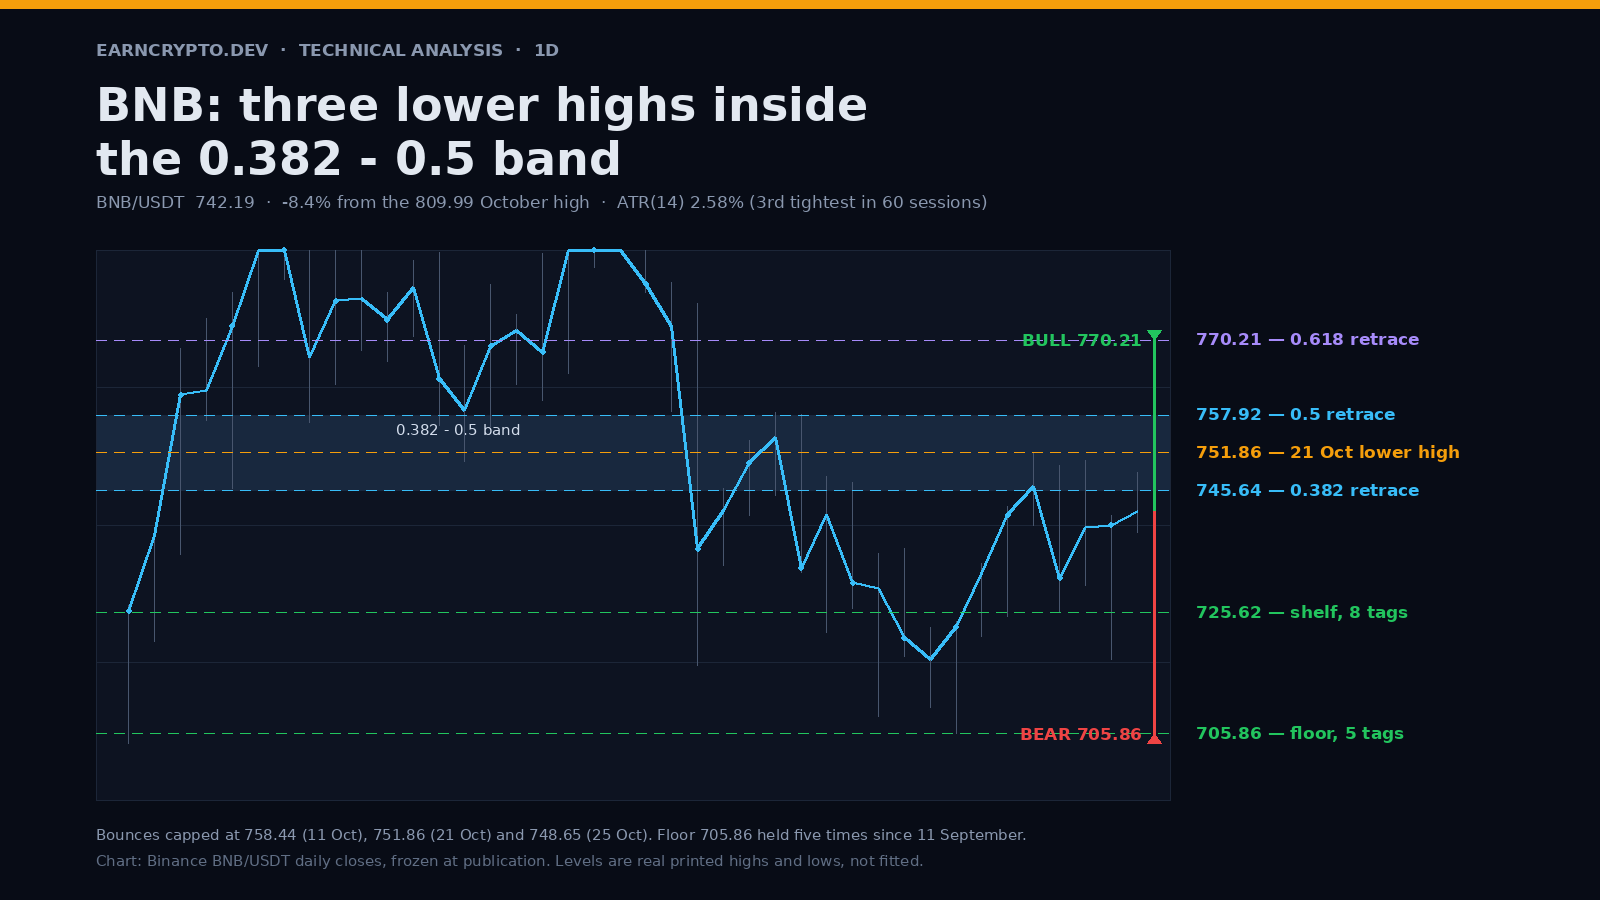
BNB is trading at 743.78 on Sunday, 1.86 points under the 0.382 retrace of its October slide and 14.14 points under the 0.5. Since the 809.99 top on 5 October the chart has produced exactly three bounce highs — 758.44 on 11 October, 751.86 on 21 October and 748.65 today — and all three died inside the same twelve-point band.
The October leg: 809.99 on 5 October down to 705.86 on 18 October, 104.13 points or 12.9%. The recovery has been competent but not convincing. Price is 3.49 points above its 20-day at 740.29, 6.37 points under the 50-day at 750.15, and still 8.4% below the top.
Advertisement
Three lower highs, one band
758.44 on 11 October (758.03 the next session) is a 50.5% retrace of the leg — 0.52 points above the 0.5 at 757.92. 751.86 on 21 October is a 44.2% retrace, 6.22 points above the 0.382 at 745.64. Today's 748.65 is a lower high again: it stopped 3.01 points above the 0.382 before the session gave back to 743.78. Lower highs into the same retrace band is distribution until it is proven otherwise.
The 745.64 line is the whole decision
The 0.382 at 745.64 is not a lonely line. It sits inside a band that has been traded in both directions: highs at 746.01 on 9 October, 748.00 on 13 October and 747.00 on 14 October, lows at 745.90 on 20 September and 744.77 on 11 October. Above it the ceiling is a stack — the three-tag rejection zone at 748.65 to 751.86, the 50-day at 750.15, and the 0.5 at 757.92. A daily close above 745.64 is the first sign the stack is being tested rather than defended.
Advertisement
What is underneath
First support is 725.62, a shelf with eight tags since 12 September: highs at 725.32 (15 September), 726.77 (16 September), 723.27 (17 October) and 724.25 (18 October), lows at 725.06 (12 September), 726.27 (14 October), 725.00 (20 October) and 725.62 (22 October). Eight prints inside a 3.5-point band is the strongest horizontal on the chart.
Below that is the floor: 706.50 on 11 September, 707.04 on 15 September, 704.29 on 16 September, 708.64 on 15 October and 705.86 on 18 October. Five prints of the same 704 to 709 zone across two different months, which is why the 18 October low is worth more than a single wick.
The two roads
Bear: a daily close under 725.62 opens 718.00 — the 24 October low, and 717.07 from 8 October is a point away — then the 705.86 floor. The 46.00-point range from 751.86 down to the floor projects 659.86 on a break, but 674.60 from 1 September and 676.98 from 23 August sit in front of that target, so the honest first objective is 674 to 679.
Bull: reclaim 751.86 and the 0.5 at 757.92 is six points away. Above it the 0.618 at 770.21 lines up with the September highs at 768.92 (18 September) and 777.98 (20 September), which is where the last real supply printed before the top. The 787.71 level, the 0.786 retrace, is the reach objective if the whole slide is retraced as a normal correction.
What invalidates this
A daily close above 757.92 puts the three lower highs in the wrong order and turns the October slide into an ordinary retracement; the case for 705.86 dies there. A close back under the 20-day at 740.29 hands the initiative to the 725.62 shelf. And volatility is quiet in a way that usually precedes the answer: ATR(14) is 19.11 points, 2.58% of spot and the third-tightest of the last sixty sessions, with today's range at 9.83 points against a 2.535% ten-day average.
The market has spent five weeks building a ceiling it keeps failing into and a floor it keeps bouncing from. Between 745.64 and 725.62 there is nothing but air, and whichever edge closes first will decide the next hundred points.
Written by
EarnCrypto.dev Editorial
The EarnCrypto.dev editorial team researches and reviews AI mining platforms, pools and earning tools — publishing only what passes our own checks.
Related reading
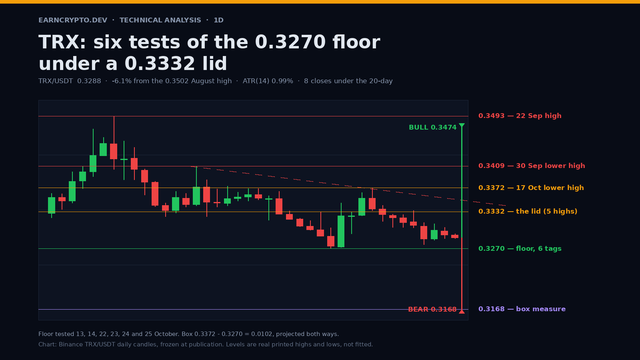
TRX Daily Analysis — Six Tests of the 0.3270 Floor Under a 0.3332 Lid: 0.3168 or 0.3474
TRX has printed six sessions of lows inside 0.0017 on the 0.3270 floor while a 0.3332 lid caps every bounce, and the 0.0102 box projects 0.3168 or 0.3474.
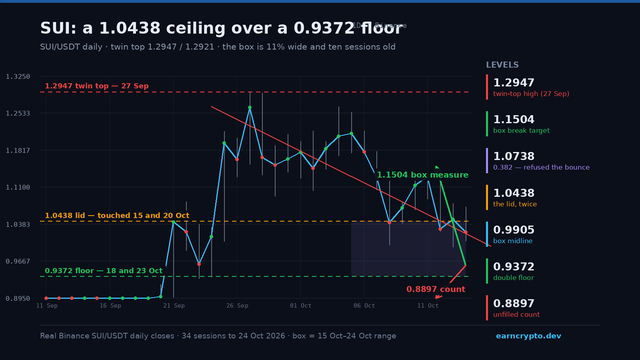
SUI Daily Analysis — A Twin Top at 1.2947 and a Ten-Session Box: The 0.9372 Floor Decides 1.1504 or 0.8897
SUI's 27.6% slide stopped twice at 0.9372 and the lid twice at 1.0438. The box has held for ten sessions and is 11.1% wide — here is where a break pays out.
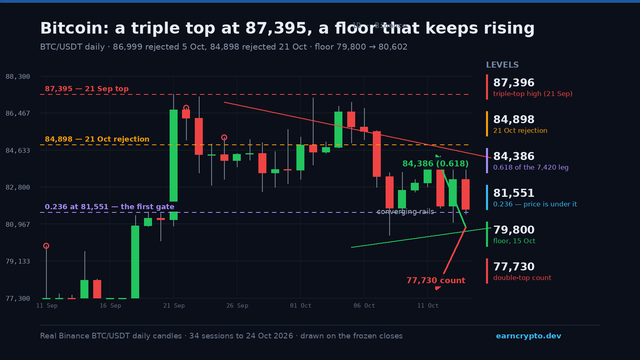
BTC Daily Analysis — A Triple Top at 87,395 Squeezed Into a 3,902-Point Triangle: 81,551.12 Decides 84,385.56 or 77,730.33
Bitcoin failed at 87,000 three times and held 79,800 four. Price sits 695 under the 0.236 at 81,551 inside a converging triangle — here is the daily map.