
BTC Daily Analysis — A Triple Top at 87,395 Squeezed Into a 3,902-Point Triangle: 81,551.12 Decides 84,385.56 or 77,730.33
Bitcoin failed at 87,000 three times and held 79,800 four. Price sits 695 under the 0.236 at 81,551 inside a converging triangle — here is the daily map.
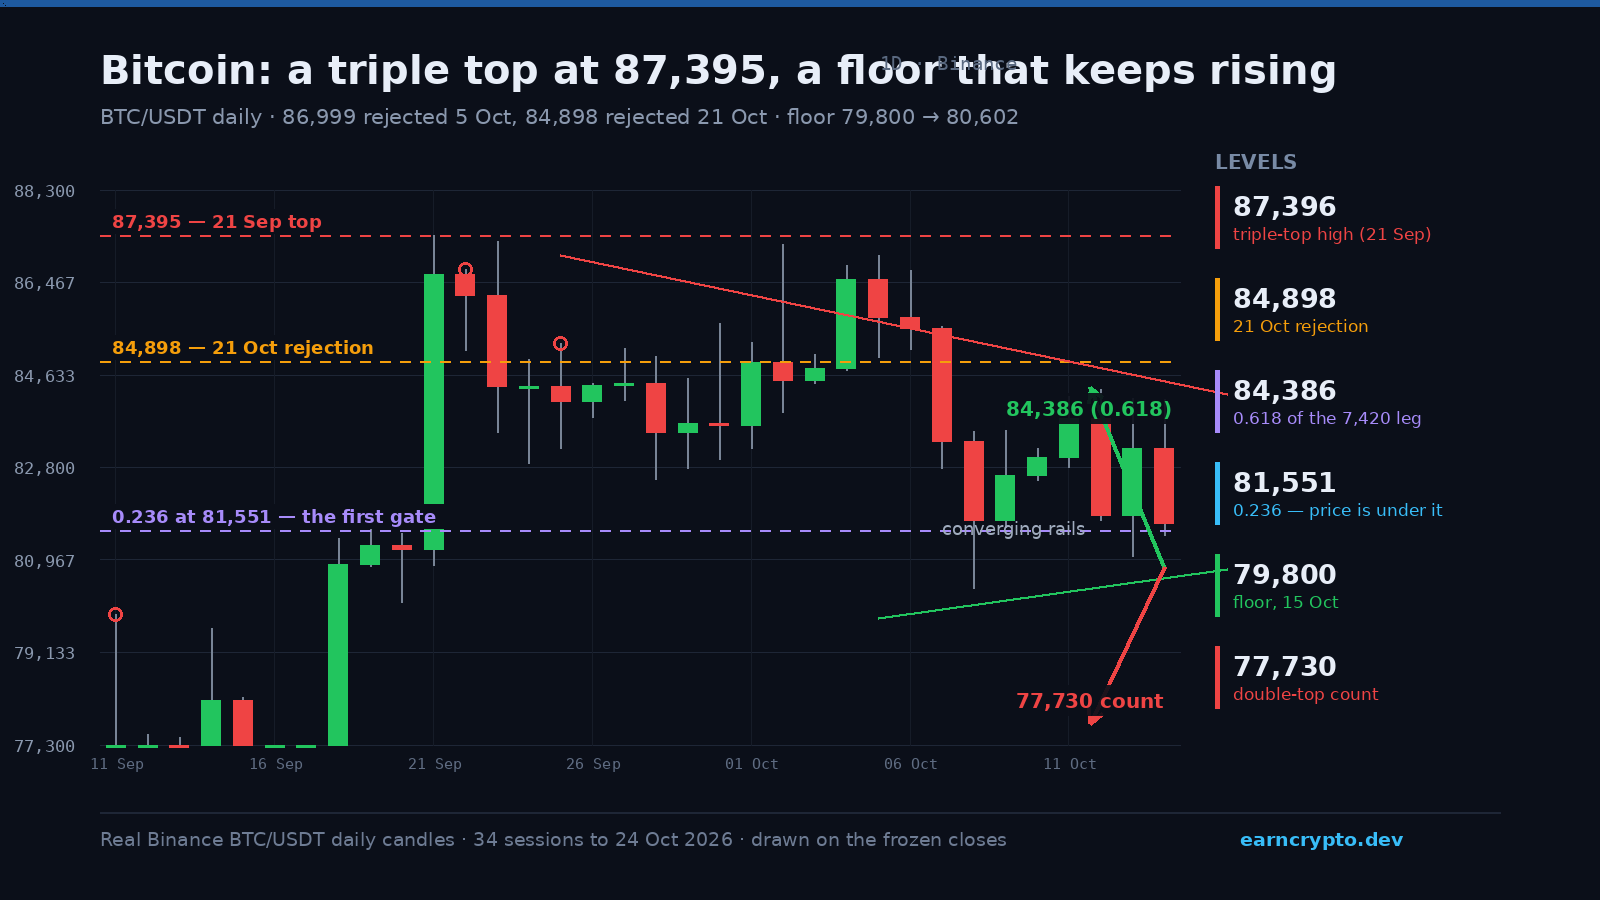
Bitcoin has spent thirty-three sessions building a ceiling it cannot crack and ten sessions defending a floor it cannot leave, and on Saturday it sits nearer the bottom of that box than the top. The 21 September high at 87,395.67, the 2 October high at 87,220.00 and the 5 October high at 86,999.11 are three separate rejections inside one supply shelf. The lowest low between them — 82,563.00 on 28 September — is the neckline, which makes the structure 4,832.67 points tall and puts its measured target 4,832.67 below that neckline, at 77,730.33.
Price last traded at 80,855.73, which is 1,707.27 under the neckline and 253.74 above the session low. Today's candle is a narrow one: 611.65 points from wick to wick, 0.76% of spot, on 2,831.82 BTC — a 0.20x pace against the twenty-day average of 14,116.21. That is not a session that resolves anything, and it follows a 22 October session that closed 2,677.33 under its own open, giving back most of the previous day's 1,065.27-point gain. The same chart on Binance's BTC/USDT pair shows the three tops as one band rather than three events.
Advertisement
The Ceiling Falls 131 Points a Session
Draw the ceiling through the 5 October high at 86,999.11 and the 21 October high at 84,898.00 and it drops 131.32 points per session, which puts it at 84,504.04 for today. Nothing has closed above it since 5 October, and the 21 October poke is the cleanest example of why: the wick printed 84,898.00, the close came in at 84,093.42 — 804.58 under the high — and the next session lost another 2,677.33 points.
The Floor Is a Rising Rail, Not a Line
The floor is easier to read than the ceiling because it has been tested more often. 79,800.00 printed on 15 October, 80,513.00 printed on 23 October, and a rail through those two lows rises 89.1 points a session — which projected 80,602.12 for today's session. Today's low came in at 80,601.99, within a tenth of a point of the projection. That is the third touch, and it is the reason the two rails are converging instead of breaking.
Advertisement
The gap between the two rails has narrowed to 3,901.92 points: 84,504.04 at the ceiling against 80,602.12 at the floor. At the current slopes they cross near 82,180, roughly seventeen sessions out, in the second week of November. Triangles resolve; they do not sit still — the question is only which side gets tested first.
81,551 Is the First Gate, 82,621 Is the Real One
The 7,420-point leg from 87,220.00 down to 79,800.00 gives a 0.236 at 81,551.12, and price has closed under it in each of the last three sessions. Above it the 0.382 sits at 82,634.44, which is 10.39 points from the twenty-day average at 82,624.05 — close enough to treat as one level rather than two. The fifty-day average at 81,846.46 sits 990.73 over price, so both averages are above the market. The ATR(14) of 2,062.02 is 2.55% of spot, so a normal session can travel most of the distance to that confluence without anything unusual happening.
What the Count Still Needs
Measured from the neckline, the triple top has delivered 1,707.27 of its 4,832.67 points, or 35.3% of the move, with the close at 80,855.73. The remaining 3,125.40 points end at 77,730.33. If the rising floor goes first, the honest sequence is a daily close under 79,800.00, a retest of the 77,730.33 count, and then the triangle's own 3,902-point height measured from the break — which lands near 75,898. None of that is a forecast; it is what the geometry pays if the floor fails.
What Would Break the Bear Case
Two consecutive closes above 81,551.12 would put price back over the 0.236 with the 0.382 and the twenty-day average waiting 1,778.71 higher as a single wall. A close through that wall turns 84,385.56 — the 0.618 of the leg — into the next target, and above it the measured picture stops being bearish at all, because the descending ceiling would have been broken rather than touched. The 0.786 at 85,632.12 is the line that would make the 87,395 shelf the argument again.
Six closes under the neckline in the last eight sessions, price under both moving averages, and a ceiling that has rejected every high for nineteen sessions: the path of least resistance still points down, but the floor has answered four times. Watch 81,551.12 and 79,800.00. Everything between them is noise. Level conversions on the way to a decision are on the site's crypto converter.
Written by
EarnCrypto.dev Editorial
The EarnCrypto.dev editorial team researches and reviews AI mining platforms, pools and earning tools — publishing only what passes our own checks.
Related reading
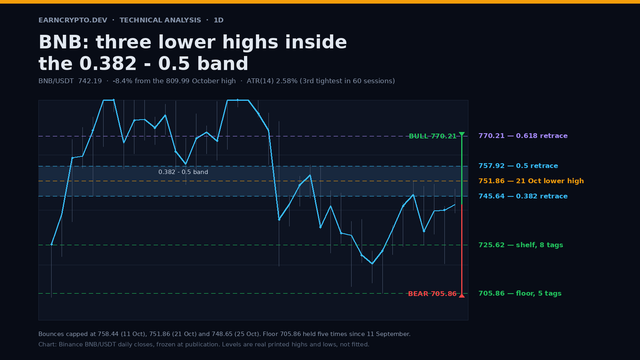
BNB Daily Analysis — A Third Lower High at 748.65 Under the 0.5 at 757.92: 745.64 Decides 770.21 or 705.86
BNB has made three lower highs — 758.44, 751.86 and 748.65 — inside the 0.382 to 0.5 band of the October slide, and 745.64 decides between 770.21 and 705.86.
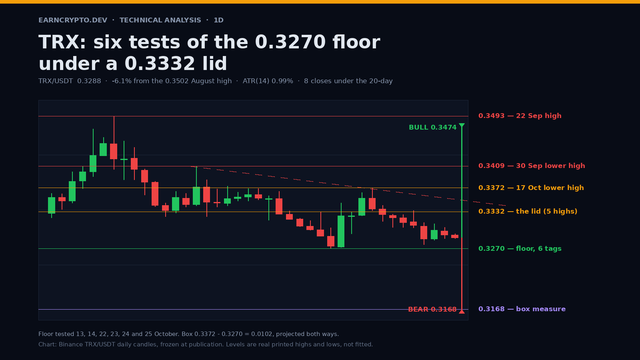
TRX Daily Analysis — Six Tests of the 0.3270 Floor Under a 0.3332 Lid: 0.3168 or 0.3474
TRX has printed six sessions of lows inside 0.0017 on the 0.3270 floor while a 0.3332 lid caps every bounce, and the 0.0102 box projects 0.3168 or 0.3474.
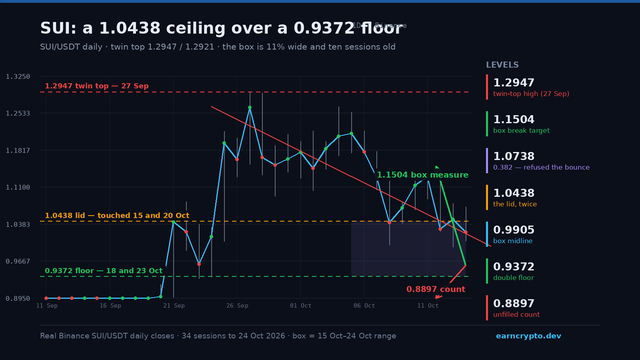
SUI Daily Analysis — A Twin Top at 1.2947 and a Ten-Session Box: The 0.9372 Floor Decides 1.1504 or 0.8897
SUI's 27.6% slide stopped twice at 0.9372 and the lid twice at 1.0438. The box has held for ten sessions and is 11.1% wide — here is where a break pays out.