
SUI Daily Analysis — A Twin Top at 1.2947 and a Ten-Session Box: The 0.9372 Floor Decides 1.1504 or 0.8897
SUI's 27.6% slide stopped twice at 0.9372 and the lid twice at 1.0438. The box has held for ten sessions and is 11.1% wide — here is where a break pays out.
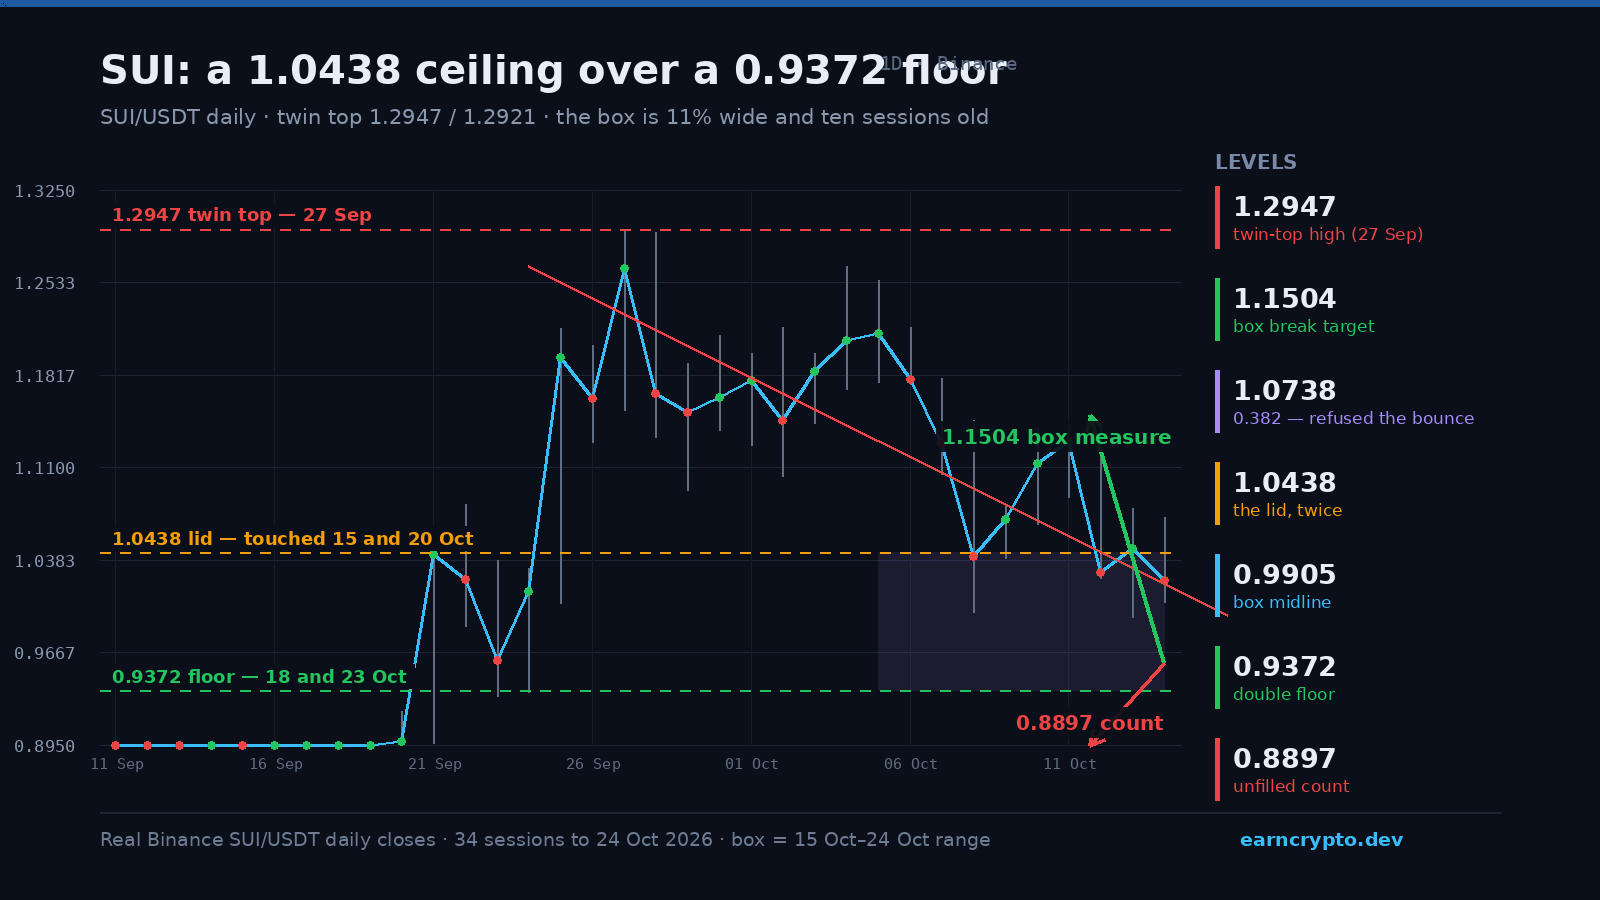
SUI lost 27.6% of its value between 27 September and 18 October, and it has spent the ten sessions since coiling inside an 11.1%-wide box instead of continuing. The top is a twin: 1.2947 on 27 September and 1.2921 the next session, the second one printed on 174,511,157 SUI — the heaviest daily volume of the last thirty sessions. The neckline is the 29 September low at 1.0922, which makes the pattern 0.2025 tall and its measured target 0.8897, a level price has not reached.
From the neckline the count is 66.0% filled: 0.1337 of the 0.2025 tally has printed, with the close at 0.9585. That leaves 0.0688 between price and the target, under a floor that has now been tested twice, and it is the main reason this chart reads as a pause rather than a bottom. Live depth on Binance's SUI/USDT pair shows the same two-sided book.
Advertisement
The 0.382 Refused the Only Bounce
The recovery out of the 18 October low reached 1.0566 on 21 October, which is a 33.4% retracement of the entire slide — 0.0172 short of the 0.382 at 1.0738, and 0.0594 under the 0.5 at 1.1159. Two sessions later price was back at 0.9400 on 23 October, 0.0028 above the original floor. A bounce that cannot reach the first Fibonacci step is not a reversal; it is a lower high being installed.
A Ten-Session Box, 11% Wide
The lid is not one price but two: 1.0431 on 15 October and 1.0438 on 20 October, with the 21 October wick to 1.0566 closing back at 1.0293. The floor is 0.9372 on 18 October and 0.9400 on 23 October. Measured across, the box is 0.1066 wide, 11.12% of spot, and its midline sits at 0.9905 — price at 0.9585 is 2.3% above the floor and 8.2% under the lid, which is the bottom half of a range that has not yet chosen.
Advertisement
Volatility is compressing with it: the ATR(14) is 0.0639, 6.67% of spot, and today's session — barely seven hours old — has printed a 0.0188 range on 4,944,546.90 SUI, a 0.09x pace against the twenty-day average of 52,932,881.76. A quiet Saturday inside a ten-session box is not evidence of anything except that neither side has paid up.
Lower Highs Still Point Down
The trendline through the 4 October high at 1.2655 and the 21 October high at 1.0566 falls 0.0123 a session and reads 1.0197 today. Every cap since 4 October — 1.1422, 1.0431, 1.0566 — sits under it. Price is also 0.0893 under the twenty-day average at 1.0478, and 0.0243 under the fifty-day at 0.9828, so both averages sit above the market while the range narrows underneath them.
Both Roads Out of the Box
Up: a close back over the midline at 0.9905 opens the 0.236 at 1.0216, and the lid at 1.0438 is the line that decides whether this was accumulation. Above it the box measures 1.1504, which sits just over the 0.5 retrace at 1.1159 and would put the twin top back in play. Down: 0.9372 is the only level that matters. A close under it leaves the unfilled count at 0.8897 as the first target and the box's own height measured lower — 0.8306 — as the second.
What Invalidates Each Side
A daily close above 1.0438 invalidates the lower-high sequence and makes the 0.8897 count stale; that is the one outcome the chart does not currently support, because it would need a lid that has rejected twice to fail on the third attempt. A daily close under 0.9372 confirms it, and would do so with a third of the count still unfilled. Between those two lines the honest read is a coil: watch 0.9905 first, because it is the level that turns a ten-session box into a directional bet. Position sizing and level maths are on the site's tools directory if you want the exposure side of it sorted before the break.
Written by
EarnCrypto.dev Editorial
The EarnCrypto.dev editorial team researches and reviews AI mining platforms, pools and earning tools — publishing only what passes our own checks.
Related reading
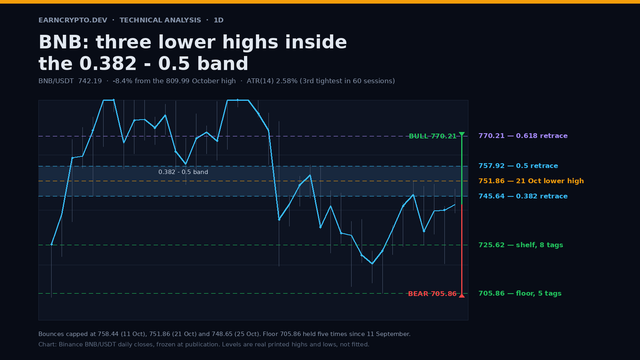
BNB Daily Analysis — A Third Lower High at 748.65 Under the 0.5 at 757.92: 745.64 Decides 770.21 or 705.86
BNB has made three lower highs — 758.44, 751.86 and 748.65 — inside the 0.382 to 0.5 band of the October slide, and 745.64 decides between 770.21 and 705.86.
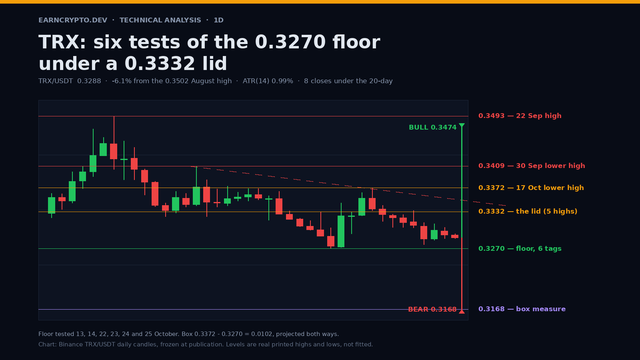
TRX Daily Analysis — Six Tests of the 0.3270 Floor Under a 0.3332 Lid: 0.3168 or 0.3474
TRX has printed six sessions of lows inside 0.0017 on the 0.3270 floor while a 0.3332 lid caps every bounce, and the 0.0102 box projects 0.3168 or 0.3474.
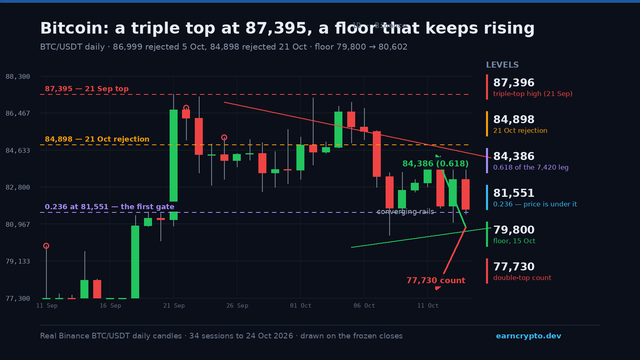
BTC Daily Analysis — A Triple Top at 87,395 Squeezed Into a 3,902-Point Triangle: 81,551.12 Decides 84,385.56 or 77,730.33
Bitcoin failed at 87,000 three times and held 79,800 four. Price sits 695 under the 0.236 at 81,551 inside a converging triangle — here is the daily map.