
TRX Daily Analysis — A 0.3502 Double Top and a Triple-Touch 0.3270 Floor: 0.3323 Decides 0.3543 or 0.3047
TRX has held 0.3270 three times under a 0.3502 double top and coiled into 3.1% of range. A close over 0.3323 opens 0.3543; losing 0.3270 measures 0.3047.
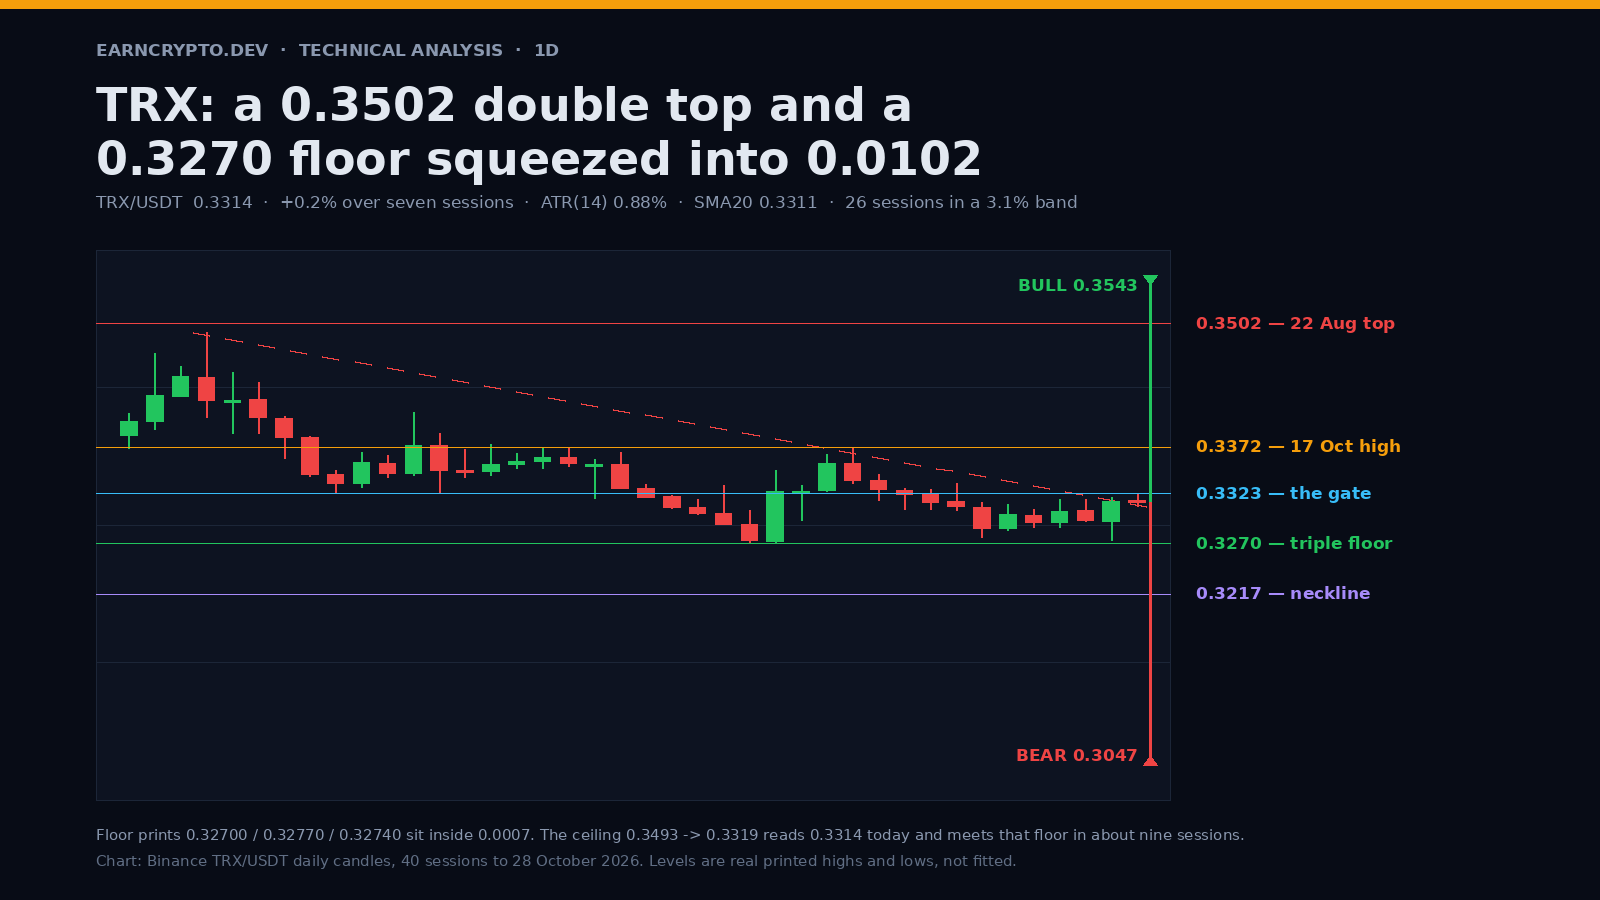
Two tops, thirty-one sessions apart
TRX printed its window high at 0.3502 on 22 August on 198.6 million tokens, 2.58 times the trailing twenty-day average. Thirty-one sessions later, on 22 September, it printed 0.3493 on 165.8 million — 2.00 times its own average and 0.0009 below the first attempt. Two rejections at the same price, a month apart, 0.26% apart, is a lid rather than a base, and neither session closed above the level it tested.
Between the two tops the market gave up to 0.3217 on 2 September, which is the neckline for the whole formation. Spot is 0.3313 at the time of writing: 5.4% under the August high and 1.3% over the 13 October floor.
Advertisement
The retest came with less force than the original push, 2.00x against 2.58x, and every pivot high since has stepped down: 0.3409 on 30 September, 0.3372 on 17 October, 0.3334 on 21 October and 0.3323 today. That is a slow distribution of the August candle, not a markdown.
A month that fits in three days of range
Twenty sessions have traded between 0.32700 and 0.33720. The band is 0.0102, 3.1% of spot, while ATR(14) is 0.00292, or 0.88%. The whole month fits inside three and a half average daily ranges. Today has covered 0.0014, 0.42%, on a 0.21x volume pace against a twenty-day average of 78.4 million.
Advertisement
The floor under that band is not a line anyone drew. 13 October bottomed at 0.32700, 22 October at 0.32770 and 27 October at 0.32740: three touches inside 0.0007, or 0.21% of spot, and no close below 0.3270 anywhere in the last sixteen sessions.
One heavy session in three weeks tells you who defends it. 14 October traded 163.9 million, 2.19 times its trailing average and the heaviest print in twenty-one sessions, and it reversed from a 0.3272 low to close at 0.3325. Since then the heaviest is 91.3 million on 27 October, and the two quietest are 44.1 and 45.0 million on 24 and 25 October.
The bull case: 0.3323 is the gate
The descending ceiling through 0.3493 (22 September) and 0.3319 (27 October) falls 0.0005 a session and reads 0.3314 for today, a tick above where spot closed. It has three touches: the 22 September high, the 17 October high at 0.3372, which printed 0.0003 above it, and the 27 October high. The 30 September high at 0.3409 stopped 0.0044 underneath.
Today's 0.3323 high sits 0.0009 above that rail and 0.0002 under the 0.236 retrace of the 0.3270 to 0.3502 leg at 0.3325. That is the gate. A close above it opens 0.3334, the 21 October high, then 0.3372 — and 0.3372 is the level that matters, because two consecutive closes above it end the sequence of lower highs that has held since 30 September.
Measured: the triangle's height is 0.0223, from the 0.3493 ceiling to the 0.3270 floor. Projected from a break at 0.3320 it gives 0.3543, just above the August top. I would not expect a straight line. The 50-day average at 0.3349 is falling into the path, and a level that has rejected price twice rarely gives way on the first push. The tradeable version is a close over 0.3325, a retest of 0.3314 that holds, then 0.3372.
The bear case: 0.3270 and the 0.3047 measure
The same height measures the other way. A close under 0.3270 projects 0.3047, and that is not a coincidence: it is also the 1.272 extension of the July to October range (0.3144 to 0.3502) at 0.3047. Two independent methods, one print.
Under the floor the next shelf is 0.3217, the 2 September trough and the double-top neckline. A close below it confirms the formation and measures 0.0285 down from the neckline to 0.2932, which is under the July low of the window. I would treat 0.3217 as the first real test and 0.3047 as the objective only if it breaks.
What would make a break believable: a close under 0.3270 on more than 117.7 million, 1.5 times the twenty-day average. The last three visits to the floor came on 92.3, 87.3 and 91.3 million, all under 1.2x. A break on that kind of volume is a sweep more often than a repricing, and TRX has form: 14 October wicked to 0.3272 and closed 0.0053 higher.
What invalidates both
Bull invalidation is a daily close under 0.3270, which ends the floor and hands the initiative to the bear measure. Bear invalidation is two consecutive closes above 0.3372, or one close above 0.3409.
Between 0.3270 and 0.3323 the band is 0.0053 wide, 1.6% of spot, against a 0.88% ATR: under two average days of range, which is where both sides get stopped out before the market picks a direction. The two rails meet in about nine sessions, so the resolution is close either way.
A flat floor under a falling ceiling is a decision being deferred. Twenty-six sessions and 0.0102 of range is a long deferral.
Written by
EarnCrypto.dev Editorial
The EarnCrypto.dev editorial team researches and reviews AI mining platforms, pools and earning tools — publishing only what passes our own checks.
Related reading
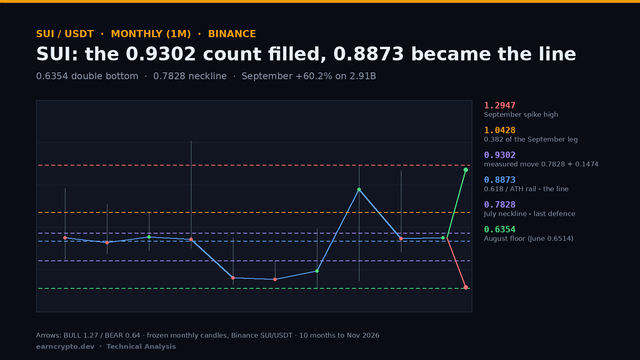
SUI Monthly Analysis — A 0.6354 Double Bottom Filled Its 0.9302 Count: The 0.8873 Retrace Decides 1.0428 or 0.7828
SUI filled the 0.9302 count of its 0.6354 double bottom at September's high and gave 22.8% back in October. The 0.8873 retrace now decides 1.0428 or 0.7828.
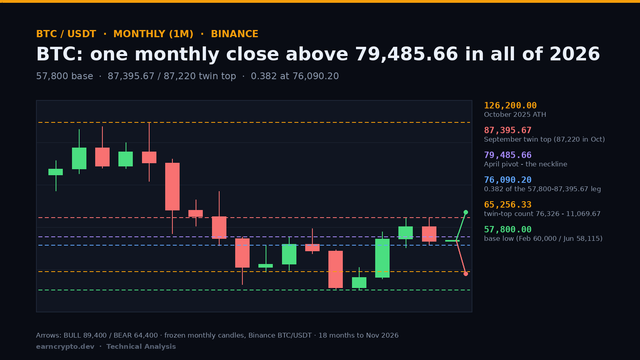
BTC Monthly Analysis — A Single 2026 Close Above 79,485.66 and an 87,395.67 Twin Top: 76,090 Decides 89,400 or 65,256
BTC closed October at 77,582, -7.2% under its open and back below the 79,485.66 pivot. The 76,090.20 retrace now decides whether 89,400 or 65,256 comes first.
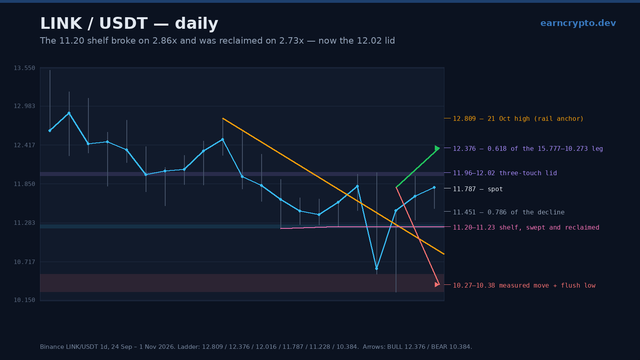
LINK Daily Analysis — The 11.20 Shelf Broke on 2.86x and Was Reclaimed on 2.73x: The 12.02 Lid Decides 12.38 or 10.38
Chainlink swept the 11.20 shelf on 2.86x volume, reversed the whole break on 2.73x and now fights a three-touch 11.96-12.02 lid. 12.02 decides 12.38 or 10.38.