
TRX Daily Analysis — Two Closes Under the 0.3324 Half-Retrace Shelf Beneath a 0.3493 Lower High: The 0.3281 Rung Decides 0.3365 or the 0.3146 Count
TRX closed twice under the 0.3324 shelf that held 27 Sep and 1 Oct, the first closes below it since 4 Sep. The 0.3281 rung decides 0.3365 or the 0.3146 count.
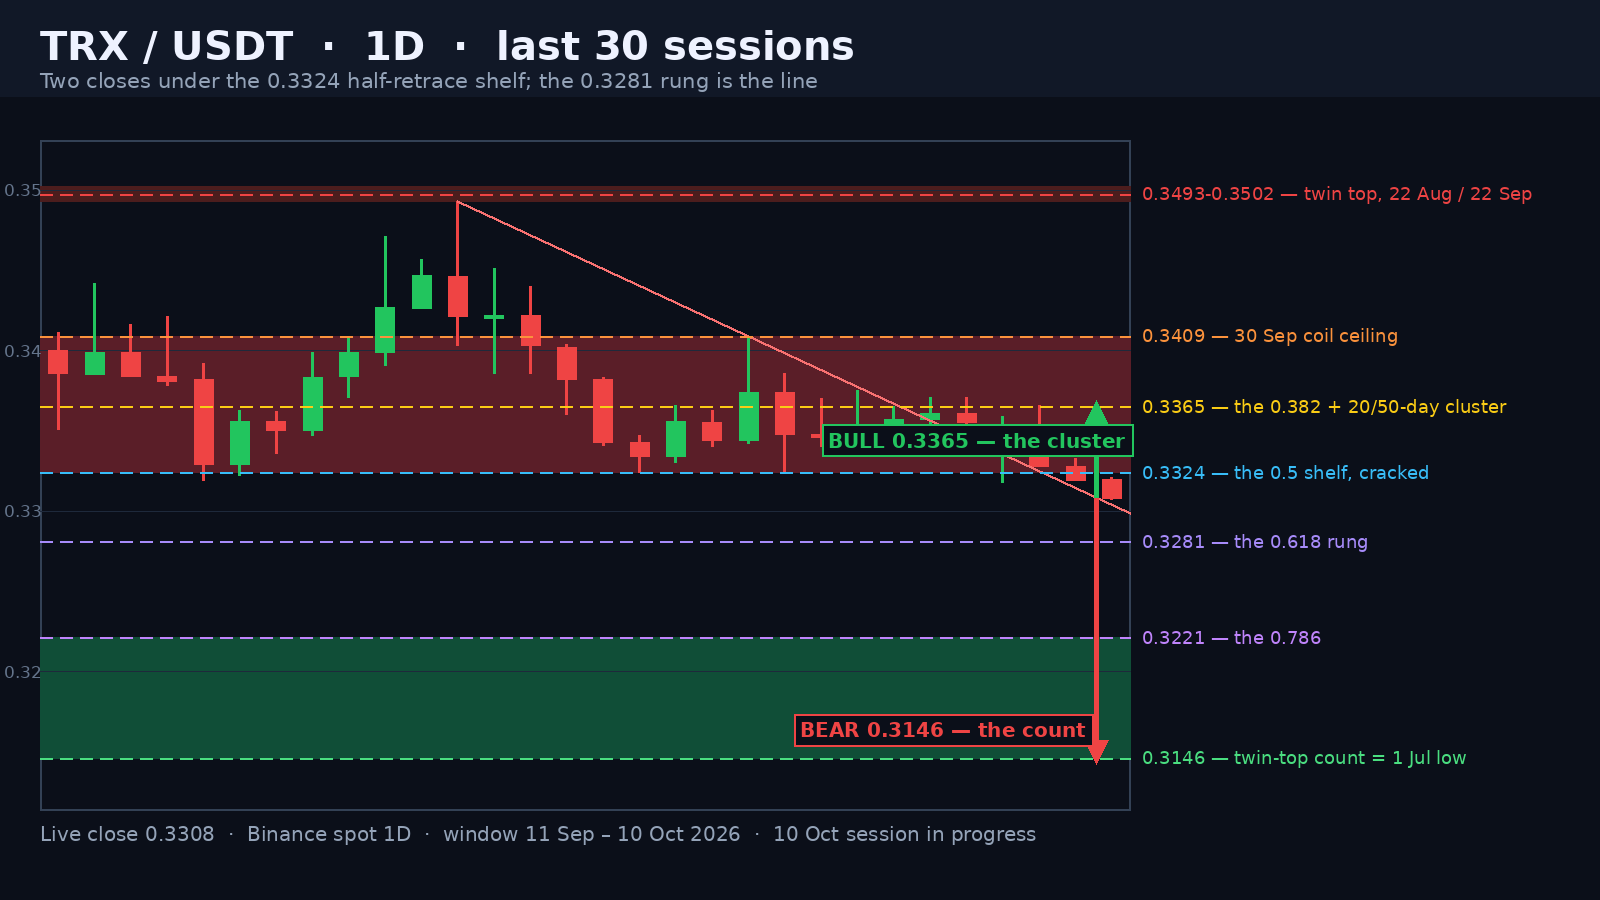
TRX is trading at 0.3307 in the opening hours of the 10 October session, 5.6% under the 0.3502 window top of 22 August and 4.87% above the 0.3146 count this structure projects. Today's range is 0.0014, 0.42% of spot, on 15,638,919 TRX in the first 7.1 hours — a pace of about 0.62x a normal full session against the 20-day average of 85,093,922. The number that matters is 0.3324: the 50% retracement of the 0.3144-0.3502 advance, defended to the tick on 27 September and 1 October. The 9 October session closed 0.3319 and today's session has printed 0.3308 — the first closes under that shelf since 4 September.
A Twin Top, and the Shelf That Held It Together
The top was not a drift either way. The 22 August candle printed 0.3502 on 198.6 million TRX, 2.58x its trailing twenty-session average and the heaviest single print of the whole 120-session window, closing 0.3442. A month later, on 22 September, the market retested it and printed 0.3493 on 165.8 million TRX — 2.00x the trailing average, the second-heaviest print of the window — and closed 0.3421, 0.0009 under the August high. Two touches of one shelf, a month apart, the second on heavy tape that could not make a new high. Underneath that top the market built its floor on a single price: 0.3324, which is the 50% retracement of the 0.3144-0.3502 advance to the tick, and which it defended with an exact low on 27 September and an exact low on 1 October. Every close from 27 September through 8 October finished inside the 0.3324-0.3409 band.
Advertisement
What the Crack Opens: Two Counts, One Pocket
The advance from the 1 July low of 0.3144 to the 22 August high of 0.3502 is 0.0358 tall, and the market is now trading under its half. The remaining rungs are measured, not guessed: 0.618 at 0.32808 and 0.786 at 0.32206, with the 17 August low of 0.3286 half a tick over the first and the 2 September low of 0.3217 two tenths of a tick above the second. The structure's own count points lower still. The twin top is 0.3502 minus the 0.3324 neckline — 0.0178 — and subtracting that from the neckline projects 0.3146. The 1 July window low printed 0.3144, 0.0002 under the count. That is not a coincidence to lean on, it is the origin of the entire move, and it is where the retracement ladder and the distribution arithmetic stop being two separate arguments. The count sits 0.0162, about 4.9% of spot, below the current price — with a 14-day ATR of 0.00311, that is roughly five average sessions of travel if the market grinds, and considerably less if the shelf break is accepted.
The Supply Shelves Above
The recovery path is not evenly supplied. The first line is 0.3324 itself: a market that closes back above its own 50% retracement within a session or two of losing it has swept the level, not broken it. Above it the 0.382 at 0.33652 sits inside a real cluster — the 20-day average at 0.33629 and the 50-day at 0.33660 are 0.0004 apart, and the 4 October high printed 0.3365. The 5 and 6 October highs printed 0.3371 twice, on 0.82x and 0.78x tape, which is the tell for the whole coil: the highs were getting lower on volume that was disappearing. The 30 September high at 0.3409 — also the 50% retracement of the 0.3493-0.3324 leg — is the last gate before the twin top. Above 0.3409 the falling rail anchored at 0.3493 opens 0.3442 and then the top itself.
Advertisement
What Each Side Needs
The bull case needs a daily close back above 0.3324 to turn the broken shelf into support. That unlocks the 0.3365 cluster, then 0.3409, and a close over 0.3409 puts the 0.3493-0.3502 top back on the table with the falling rail already broken. The tape argues against speed: the two sessions that cracked the floor traded 104.3 million and 95.7 million TRX, 1.27x and 1.13x their trailing averages, and neither was as heavy as the 22 September 165.8 million. This path dies on a daily close under 0.3281, because that is the 0.618 and it confirms the shelf break.
The bear case is the same chart read from the shelf down. Under 0.3281 the next rungs are 0.3221 — the 0.786 sitting two tenths of a tick over the 2 September low of 0.3217 — and then the 0.3146 count, which is the 1 July low to within 0.0002. The bear case cancels on a daily close back above 0.3324, because that is the shelf both of the last two sessions closed under, and it is the same line that held for twelve sessions.
Two exact touches and twelve closes, undone by two sessions. The shelf the market defended at 0.3324 was the 50% retracement of the whole July-August advance, and the count under it lands two tenths of a tick from the July low.
Written by
EarnCrypto.dev Editorial
The EarnCrypto.dev editorial team researches and reviews AI mining platforms, pools and earning tools — publishing only what passes our own checks.
Related reading

SOL Weekly Analysis — A 17-Week Doubling Topped Twice at 124.95 / 123.76: The 116.32 Neckline Decides 124.95 or 100.19
SOL doubled 107.8% in 17 weeks into a 124.95 / 123.76 two-touch top and paid its 108.29 count to 105.71. The 116.32 neckline decides 124.95 or 100.19.

AVAX Weekly Analysis — A 55.2% Thrust and Four 2x-Volume Weeks Under a 12.008 Two-Touch Top: The 10.866 Retrace Decides 14.25 or 8.387
AVAX ran a 55.2% week on 2.27x volume, then coiled four weeks under an 11.799 / 12.008 two-touch top. The 10.866 line decides 14.25 or the 8.387 count.

ETH Daily Analysis — A 2,392.96 Count 94% Filled and Five Rising Lows Back at the 0.382: The 2,635 Line Decides 2,777 or 2,406
ETH's 2,807/2,600 distribution left a 2,392.96 count that went 94% filled at 2,406.11. Five rising lows have retaken the 0.382 — 2,635 decides 2,777 or 2,406.