
TRX Daily Analysis — Twenty-Five Closes Inside a 3.5% Band Under the $0.3493 Double Top: The $0.3319 Floor Decides 0.3667 or 0.3145
Tron has closed 25 straight sessions inside a 0.0118 band and holds the tightest ATR of the twelve majors. The 0.3319 floor decides a 0.3667 break or 0.3145.
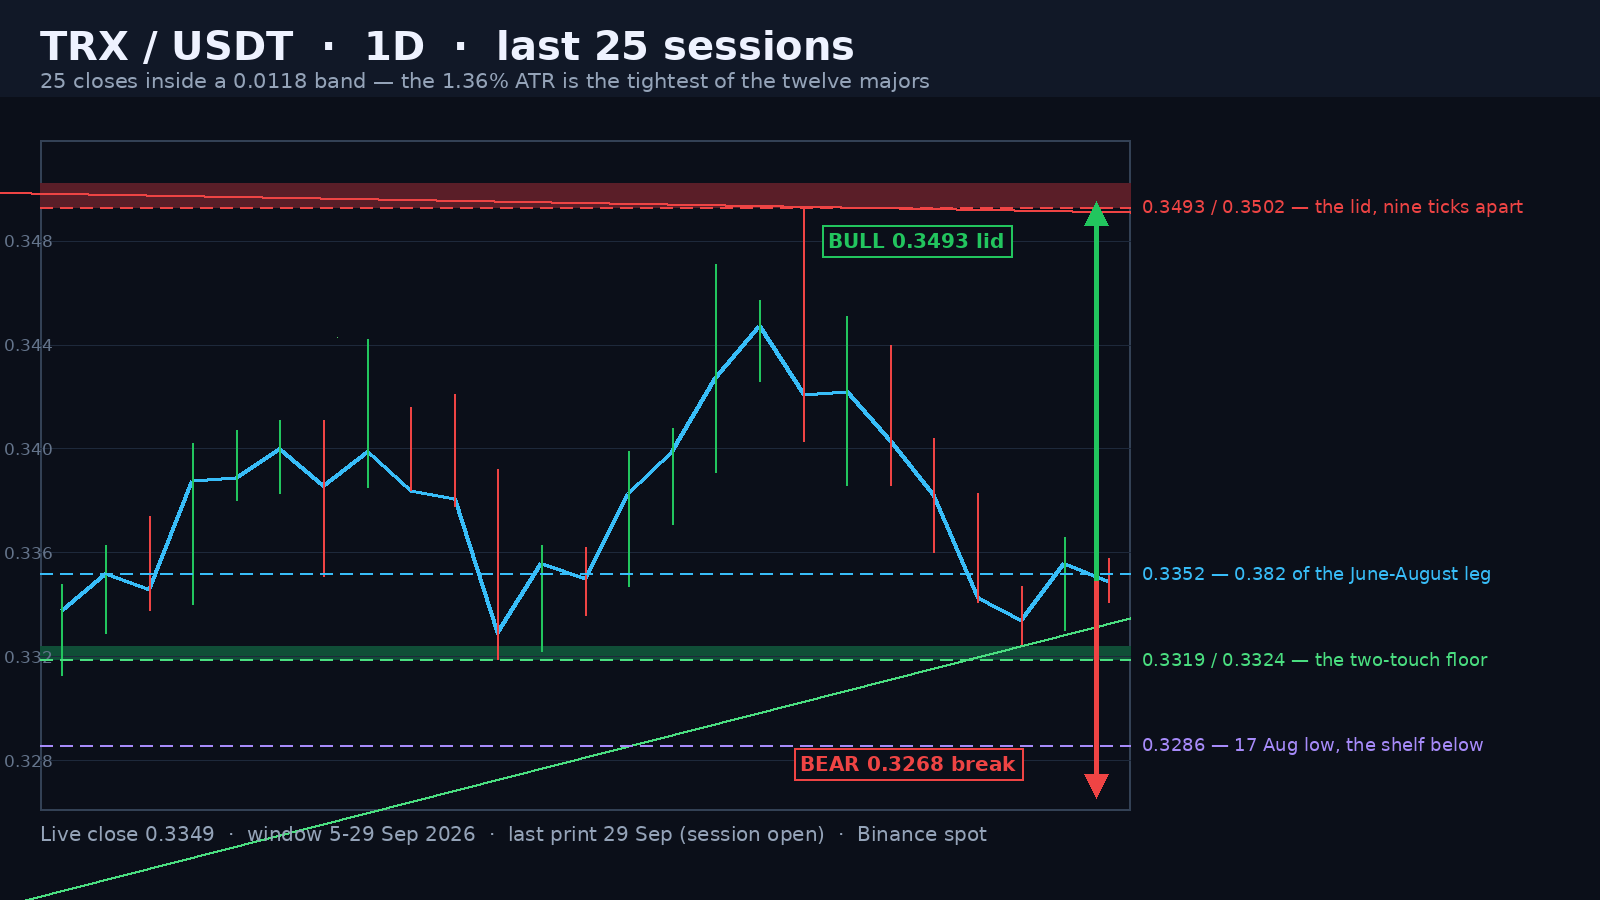
Tron is trading at 0.3349 in the opening hours of the 29 September session, inside the same 0.0118 window it has lived in for three and a half weeks and 4.37% under the 0.3502 high of 22 August. Today's range is 0.0017 — 0.51% of spot — on a 0.22x full-day volume pace against the 20-day average of 88,228,324 TRX. Thirty sessions ago it closed 0.3361, so the net move over a month is -0.36%, against +8.1% for Bitcoin, +29.1% for Cardano and +59.8% for SUI over the same stretch. This is the only one of the twelve majors with a negative 30-day return, and it is doing it on the tightest volatility in the group.
Twenty-Five Straight Closes Inside a 0.0118 Window
Since 5 September every one of the last twenty-five daily closes has landed between 0.3329 and 0.3447 — a 0.0118 window, 3.5% of spot. The 15 September close at 0.3329 is the low end, the 21 September close at 0.3447 the high end, and the 14-day ATR is 0.00456, 1.36% of spot. For scale, that is the tightest in the top twelve: Bitcoin's ATR is 2.70%, BNB's 3.17%, Ethereum's 3.39%, Solana's 4.58% and SUI's 9.29%. A market that compresses its range to half of Bitcoin's does not stay compressed; the break becomes the trade, and the direction is decided by which rail fails first.
Advertisement
The Lid: 0.3502 and 0.3493, Nine Ticks Apart
The ceiling is older than the band. The 22 August session ran to 0.3502 and closed back at 0.3388; the 22 September session did it again — 0.3493 on 2.00x volume, then a close 0.0072 under its own high. Those are the only two prints in the whole window that touched the level, thirty-one sessions apart and nine ticks apart, and the highs made between them sat lower at 0.3467, 0.3423 and 0.3442. Since the second test the market has not been able to get back: five of the last six highs printed under 0.3410, including today's 0.3358. That is a lid being tested, not a floor being built.
The Floor Has Risen From 0.3217 to 0.3324
Underneath, the lows are going the other way. The 2 September shakeout printed 0.3217, the 15 September low 0.3319 and the 27 September low 0.3324 — a rail climbing 0.0107 points over twenty-five sessions, roughly 0.00043 a session. The lid is falling at 0.00003 a session from 0.3502 to 0.3493 over thirty-one sessions, so the two rails are 0.0169 apart and closing at about 0.00046 a session, a meeting that projects into the first week of November. Between them sit two Fibonacci levels of the 0.3108-0.3502 June-to-August leg: the 0.382 at 0.3352, just three ticks over spot, and the 0.5 at 0.3305, which has not been touched since 4 September. The coil is not directionless — it is pinned between the 0.382 and the 0.5 of a completed leg.
Advertisement
What Each Side Needs
The bull case is a range break, not a rally. A daily close over 0.3447 — the top of the twenty-five-session window — puts the 0.3493 lid on immediate notice, and the count then comes from the band itself: 0.3493 minus 0.3319 is 0.0174, so a confirmed break projects 0.3667. What it needs first, and does not have, is a reclaim of the 20-day average at 0.33826 and the 50-day at 0.33661 — both now sit above spot, because the coil has pressed the price underneath its own averages. RSI is 53.6, dead centre, so there is no momentum to lean on in either direction until a rail gives.
The bear case is the same arithmetic pointing down: a daily close under 0.3319 opens 0.3145, and the double top's own count — 0.3502 minus the 0.3338 pivot of 27 August — lands at 0.3174, so the two measurements bracket a 0.3145-0.3174 zone. The move would not need to be fast: at a 0.00456 ATR, four average sessions cover the 0.0174 points to the target. The first support under the floor is the 17 August low at 0.3286, and losing that would confirm the coil failed downward. Note the volume it would take: the last three sessions printed 0.44x, 0.63x and 0.93x their 20-day averages and today's pace is 0.22x, so a break with no expansion behind it is the one most likely to be bought back.
Written by
EarnCrypto.dev Editorial
The EarnCrypto.dev editorial team researches and reviews AI mining platforms, pools and earning tools — publishing only what passes our own checks.
Related reading

SOL Weekly Analysis — A 17-Week Doubling Topped Twice at 124.95 / 123.76: The 116.32 Neckline Decides 124.95 or 100.19
SOL doubled 107.8% in 17 weeks into a 124.95 / 123.76 two-touch top and paid its 108.29 count to 105.71. The 116.32 neckline decides 124.95 or 100.19.

AVAX Weekly Analysis — A 55.2% Thrust and Four 2x-Volume Weeks Under a 12.008 Two-Touch Top: The 10.866 Retrace Decides 14.25 or 8.387
AVAX ran a 55.2% week on 2.27x volume, then coiled four weeks under an 11.799 / 12.008 two-touch top. The 10.866 line decides 14.25 or the 8.387 count.

ETH Daily Analysis — A 2,392.96 Count 94% Filled and Five Rising Lows Back at the 0.382: The 2,635 Line Decides 2,777 or 2,406
ETH's 2,807/2,600 distribution left a 2,392.96 count that went 94% filled at 2,406.11. Five rising lows have retaken the 0.382 — 2,635 decides 2,777 or 2,406.