
TRX Daily Analysis — A 0.3493 Lower High Under August's 0.3502 Top and Five Closes Inside 0.3%: The 0.3364 Retrace Decides 0.3494 or 0.3239
TRX printed a 0.3493 lower high, nine ticks under August's 0.3502 top, and coiled nine sessions in a 2.5% band. The 0.3364 retrace decides 0.3494 or 0.3239.
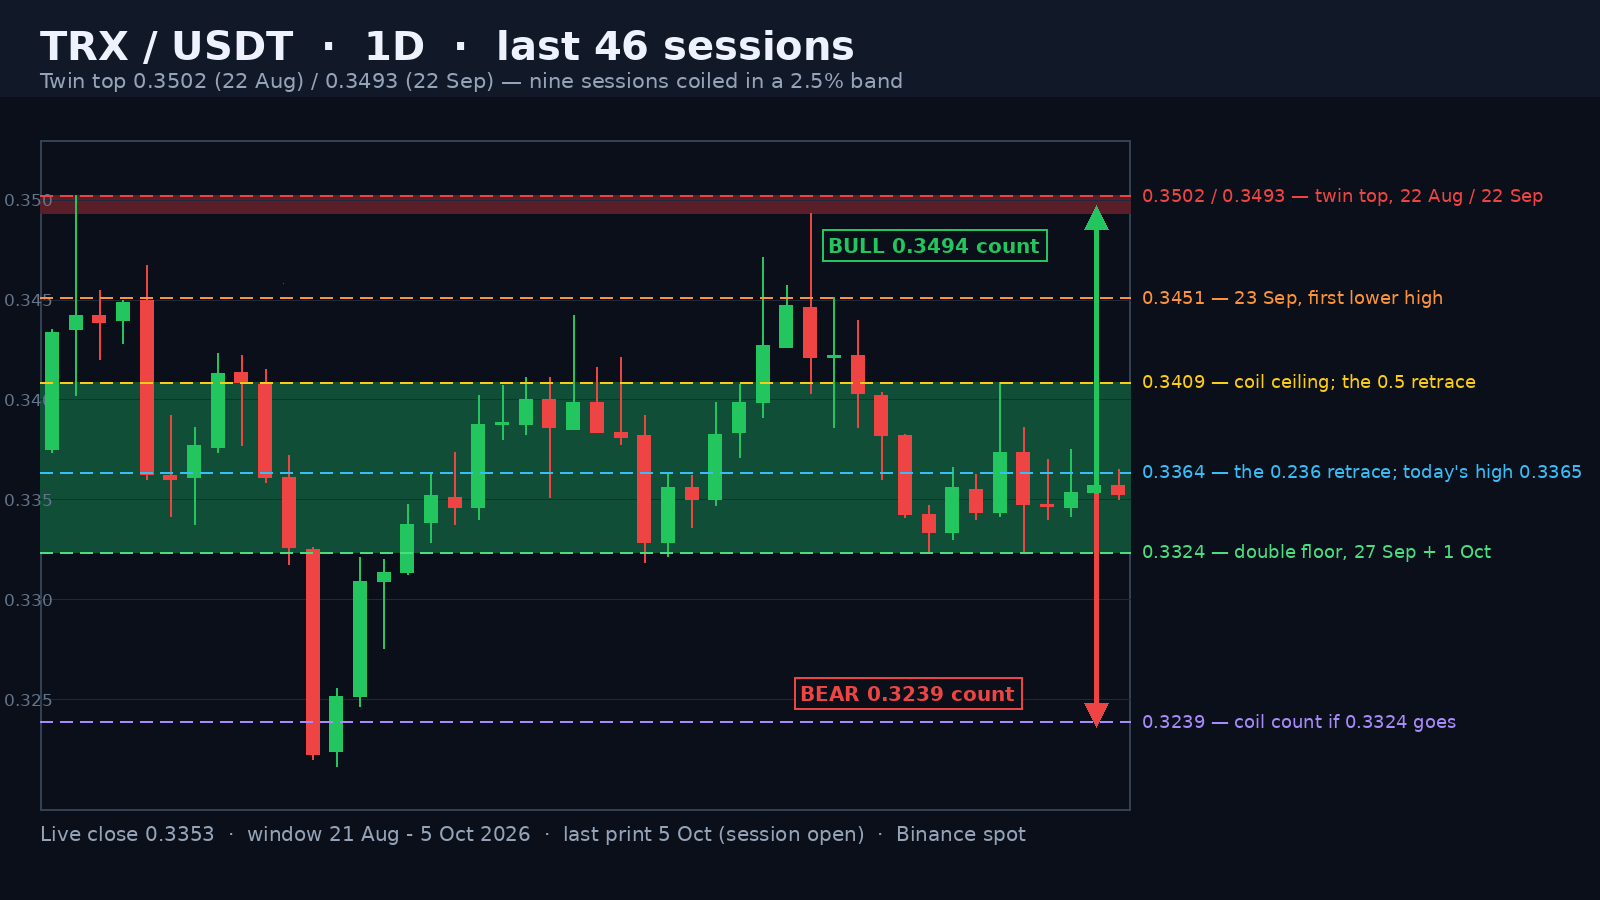
TRON is trading at 0.3353 in the opening hours of the 5 October session, 4.25% under the 0.3502 high of 22 August and 4.1% above the 0.3220 low of 1 September. Today's range is 0.0015, 0.45% of spot, on a 0.19x full-day volume pace against the 20-day average of 84.3 million TRX — the thinnest tape of the last nine sessions, and the second consecutive session under half its 20-day average. The number that matters is 0.3364: the 23.6% retracement of this month's 0.3493 - 0.3324 leg, which has capped the last four highs at 0.3370, 0.3375, 0.3365 and 0.3365 — and today's own high of 0.3365 stopped one tick above it.
A Twin Top One Month Apart — 0.3502 and 0.3493
The 22 August session is where the window peaks. It opened 0.3435, printed 0.3502 and closed 0.3442 on 198.6 million TRX — 2.36x the 20-day average and the heaviest single print of the whole 120-session window. One month later, on 22 September, the market tried the same shelf again: it opened 0.3446, printed 0.3493 — 0.0009, or nine ticks, under the August high — and closed 0.3421, on 165.8 million (1.97x). Two touches of the same region a month apart, with the second one marginally lower, is a twin top with a lower high; the pivot between them is the 0.3220 low of 1 September, which gives the pattern a 0.0282 height and a neckline that has never been tested. What followed the second touch is the important part: 0.3451, 0.3440, 0.3404, 0.3383 and 0.3347 — five consecutive lower highs into the last week of September.
Advertisement
Nine Sessions in a 2.5% Band, and Five Closes Inside 0.3%
Since 27 September the market has simply stopped moving. The last nine sessions have traded between 0.3324 and 0.3409 — a band of 0.0085, 2.54% of spot — and the five most recent closes read 0.3348, 0.3347, 0.3354, 0.3357 and 0.3353, a total spread of 0.0010, or 0.30%. Underneath, the floor has been lifting: the last five lows are 0.3324, 0.3340, 0.3342, 0.3350 and 0.3350, with 0.3324 touched twice — on 27 September and again on 1 October — and the two most recent sessions defending 0.3350 to the tick. Volume is what makes this readable: the last six sessions have printed 0.80x, 1.28x, 1.24x, 0.91x, 0.71x and 0.19x their 20-day average. Compression on falling volume is coiling, not distribution.
The 0.3364 Pocket Where Retracements Meet
Momentum has not kept up with the range. The 14-day RSI reads 28.6 while spot sits only 4.25% under the window high — the lowest reading of the last month and a print that normally belongs to a chart in free fall rather than one with a 0.0085 range. The 20-day average at 0.3375 and the 50-day at 0.3368 are both above spot, 0.66% and 0.46% respectively, and they have spent three weeks converging, which is what flattens RSI in a narrow market. The level to watch is 0.3364, because two independent measurements land on the same three ticks: the 23.6% retracement of the 0.3493 - 0.3324 leg at 0.3364 on one hand, and the 50% retracement of the wider 0.3502 - 0.3220 structure at 0.3361 on the other. The descending rail off the 23 September high at 0.3451 arrives at that pocket inside a week, and the 20-day average at 0.3375 sits a few ticks further up. A daily close above that pocket turns the coil's own 0.0085 height into a count.
Advertisement
What Each Side Needs
The bull case is a daily close above 0.3364, which puts the 0.3409 ceiling back in play — the 30 September high, and also the 50% retracement of the 0.3493 - 0.3324 leg at 0.3408. Above it the coil's own height measures 0.3494, which lands on the twin-top region itself: 0.3493 and 0.3502. That is the honest target, because a measured move that fills exactly where the pattern was built is the strongest version of the count. A confirmed break of 0.3502 would extend the same height again to 0.3587. The 14-day ATR is 0.0043, 1.28% of spot, so the market still travels 0.0064 on an ordinary day — this is a market waiting for a decision, not one that cannot move.
The bear case needs a close, not a wick. A daily close under 0.3324 — the level that has already held twice — activates the coil's count to 0.3239, and the 1 September low at 0.3220 sits 0.0019 away, so the two bracket the same shelf. Below that a full unwind of the 22-27 September leg projects 0.3155; the 38.2% retracement of the wider structure at 0.3328 is only four ticks above the coil floor, so the first real shelf under it is the 1 September low itself. And the units matter here: today's range is 0.0015 against a 20-day average of 0.0046, so this is a 0.32x session and the daily close is the only signal that carries weight. A close back above 0.3409 cancels the bear read entirely and puts 0.3494 back on the table.
Written by
EarnCrypto.dev Editorial
The EarnCrypto.dev editorial team researches and reviews AI mining platforms, pools and earning tools — publishing only what passes our own checks.
Related reading

SOL Weekly Analysis — A 17-Week Doubling Topped Twice at 124.95 / 123.76: The 116.32 Neckline Decides 124.95 or 100.19
SOL doubled 107.8% in 17 weeks into a 124.95 / 123.76 two-touch top and paid its 108.29 count to 105.71. The 116.32 neckline decides 124.95 or 100.19.

AVAX Weekly Analysis — A 55.2% Thrust and Four 2x-Volume Weeks Under a 12.008 Two-Touch Top: The 10.866 Retrace Decides 14.25 or 8.387
AVAX ran a 55.2% week on 2.27x volume, then coiled four weeks under an 11.799 / 12.008 two-touch top. The 10.866 line decides 14.25 or the 8.387 count.

ETH Daily Analysis — A 2,392.96 Count 94% Filled and Five Rising Lows Back at the 0.382: The 2,635 Line Decides 2,777 or 2,406
ETH's 2,807/2,600 distribution left a 2,392.96 count that went 94% filled at 2,406.11. Five rising lows have retaken the 0.382 — 2,635 decides 2,777 or 2,406.