
SUI Weekly Analysis — A 1.2947 Twin Top Filled 94.9% of Its 0.2025 Count: The 0.8873 Line Decides 0.9540 or 0.7767
SUI weekly: a twin top at 1.2947/1.2921 has filled 94.9% of its 0.2025 count on drying volume. The 0.8873-0.8897 band decides 0.9540 or a 0.7767 retest.
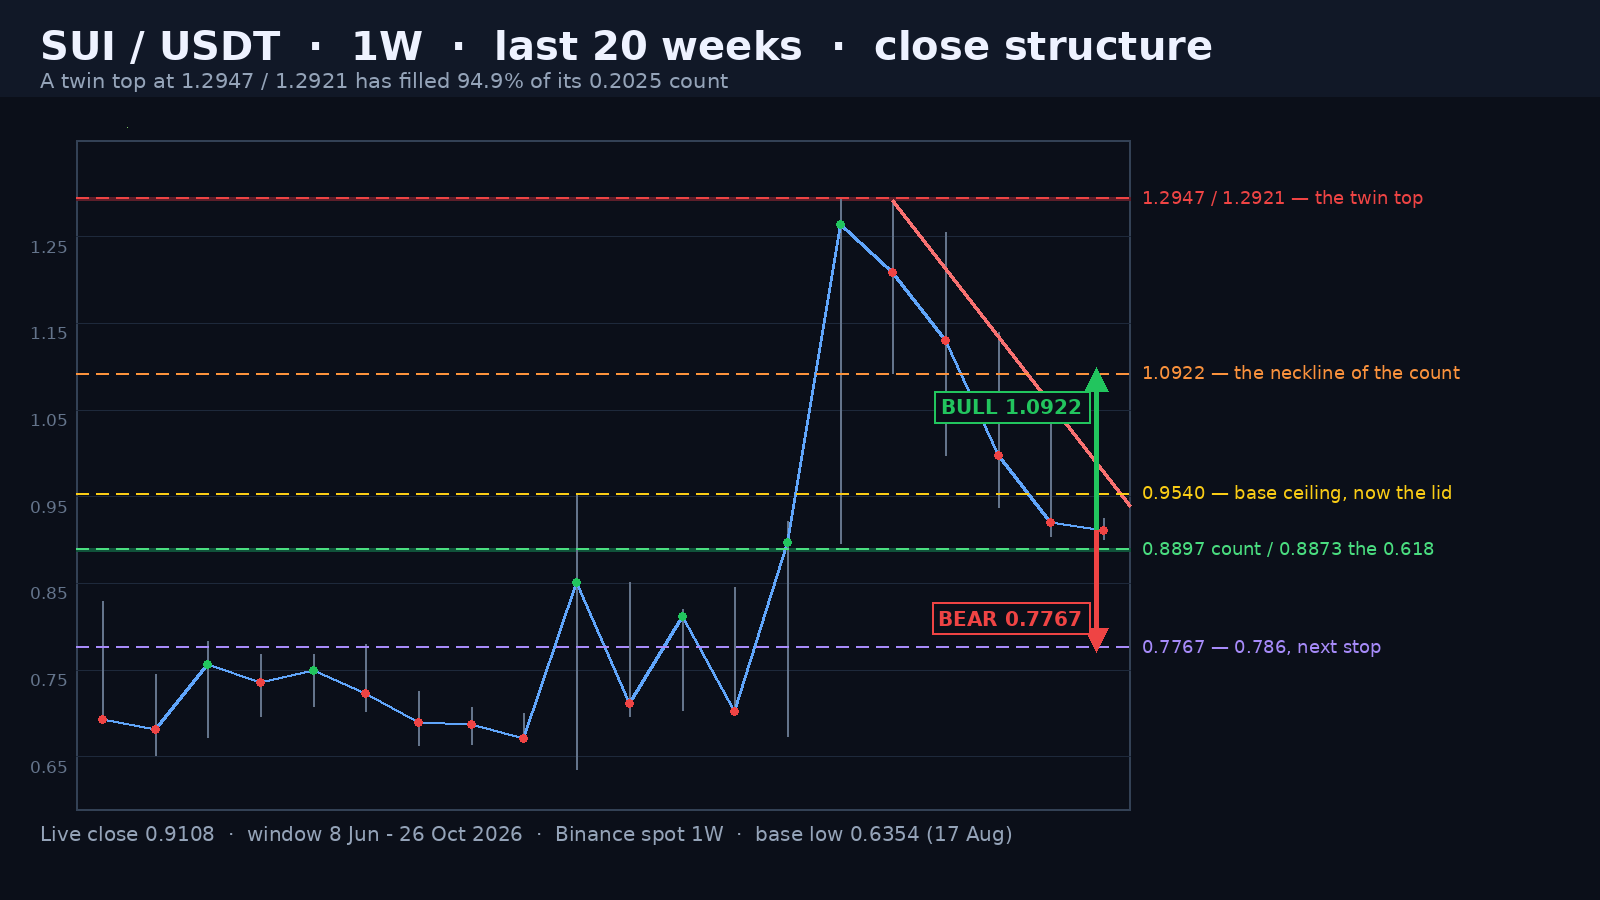
SUI's entire third quarter was decided in one week. On 21 September it opened 0.8975, printed 1.2947 and closed 1.2640 — up 40.85% — on 897.4 million SUI, which is 2.61 times the twenty-week average and the heaviest weekly volume since the week of 11 November 2024. Measured from the 0.6354 low of 17 August, that candle completed a 103.8% advance. Five weeks later SUI closed at 0.9099.
A Twin Top 0.0026 Apart
The high was made twice. 1.2947 in the week of 21 September, then 1.2921 in the week of 28 September — 0.0026, or 0.20%, lower — with the second week closing 1.2083, down 4.41%, and trading down to 1.0922. Neither peak was a thin spike: 2.61x and 1.98x the twenty-week average. A blow-off that arrives on 2.6x volume and is then refused 0.20% higher on 2.0x volume is distribution with a receipt.
Advertisement
The neckline is 1.0922, the low between the two. The count is 1.2947 minus 1.0922, which is 0.2025, and it projects 0.8897. The neckline broke in the week of 5 October, whose low was 0.998, and it has not been reclaimed since.
94.9% of the Count Is Filled
Four weeks have taken almost all of it. The 12 October week traded to 0.9372 and closed 0.9971. Last week traded to 0.9040 and closed 0.9205 — the first weekly close under the 0.5 retracement at 0.96505. This week has printed 0.9001. From the neckline at 1.0922, the market has covered 0.1921 of the 0.2025 count: 94.9%. What is left is 0.0104, which is 1.14% of price.
Advertisement
Completion of a count and the end of a move are not the same event, and the difference is the whole trade here. The measured move says 0.8897. Sitting 0.0024 under it is the 0.618 of the 0.6354-1.2947 leg, at 0.88725. Two measurements built from completely different points — a neckline and a retracement — land inside a 24-tick band. That is not coincidence, it is the market's own arithmetic, and it is being approached from 2.3% above.
The Breakout Went Back Inside the Base
The base that produced the move ran from 0.6354 to 0.9540 over seven weeks: highs of 0.9540, 0.8509, 0.8193, 0.8447 and 0.9209, all rejected, and lows of 0.6354, 0.6969, 0.7038, 0.6977 and 0.6730, none of them lower than the last. The September week broke out, closed 32.5% above the ceiling, and reached 1.2947.
Two consecutive weekly closes have now printed back under 0.9540 — 0.9205 and 0.9099 — and the current price is 1.38% above the open of the breakout week itself. That makes this a failed breakout by any honest definition: the range reclaimed its own breakout, and the ceiling is a lid again. Failed breakouts have a habit of retesting the far side of the range, which is 0.6354-0.7038, but they get there through the 20-week mean at 0.839585 before they get anywhere near the base.
The 50-week average sits at 1.024318, 12.6% above spot, and has not been reclaimed on a weekly close since the breakout week. Price is trapped between a 20-week mean 8.4% below it and a 50-week mean 12.6% above it — a compression that resolves, not a trend that continues.
The Volume Says Deceleration, Not Capitulation
The decline has been made on shrinking size. 681 million at the second peak, then 453 million (1.32x), 352 million (1.02x) and 254 million (0.74x) last week. There has been no capitulation candle — nothing resembling the 897 million that made the high, or the 1.02 billion that printed the November 2024 top. That matters for what happens at 0.8873: sellers who have already stopped expanding their size rarely produce the flush that closes a count cleanly.
The weekly lows say the same thing in a different way. 1.0922, then 0.998 — 0.0942 lower — then 0.9372 (0.0608 lower), 0.9040 (0.0332 lower) and 0.9001 (0.0039 lower). Each week the low has come closer to the last one. The descent is flattening into the confluence rather than accelerating through it, and that is the single most useful thing on this chart for the next two weeks.
A 103.8% advance, a twin top 0.20% apart, and a measured move that has delivered 94.9% of itself. SUI is 2.3% above the only band on the chart where the count and the 0.618 agree.
Both Sides, Priced
The bull case starts with a weekly close above 0.8897 that does not immediately give it back. From there the first obstacle is 0.9540, the old base ceiling, 4.8% above spot; a weekly close over it cancels the failed-breakout read and turns 0.9540 into support. Then 1.0922, the neckline, then the twin top at 1.2921-1.2947 — and 1.139105, the 0.236, sits between the two as the honest first target on any real recovery.
The bear case is a weekly close under 0.8873, which completes both measures at once and opens 0.7767 (the 0.786, 14.7% below spot), then the August lows at 0.7038 and 0.6969. Nothing in between those two zones has any structure this market has respected, which is why a weekly close under the band would be a fast move rather than a slow one.
I lean bearish at roughly 60/40, but with a specific shape: the band gets tested and probably wicked, and the reaction there decides the quarter rather than the count. The reason for the lean is not the pattern, it is the sequence — four lower highs, four lower closes, a broken base ceiling and a 0.5 fib lost on a weekly close. The reason for the caution is the other sequence: five weeks of shrinking volume and weekly lows that are compressing by 0.0942, 0.0608, 0.0332 and 0.0039. One of those two sequences ends this week.
Written by
EarnCrypto.dev Editorial
The EarnCrypto.dev editorial team researches and reviews AI mining platforms, pools and earning tools — publishing only what passes our own checks.
Related reading
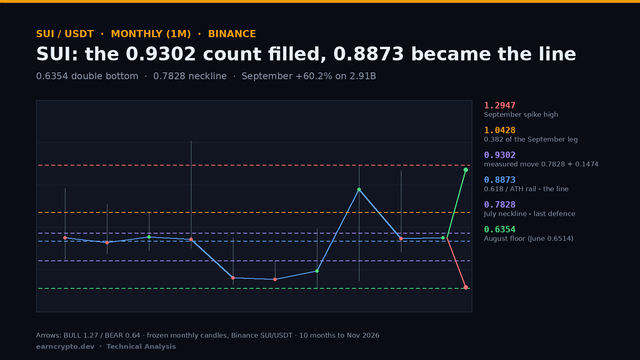
SUI Monthly Analysis — A 0.6354 Double Bottom Filled Its 0.9302 Count: The 0.8873 Retrace Decides 1.0428 or 0.7828
SUI filled the 0.9302 count of its 0.6354 double bottom at September's high and gave 22.8% back in October. The 0.8873 retrace now decides 1.0428 or 0.7828.
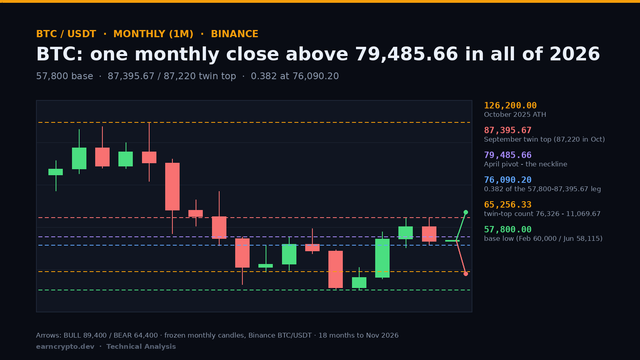
BTC Monthly Analysis — A Single 2026 Close Above 79,485.66 and an 87,395.67 Twin Top: 76,090 Decides 89,400 or 65,256
BTC closed October at 77,582, -7.2% under its open and back below the 79,485.66 pivot. The 76,090.20 retrace now decides whether 89,400 or 65,256 comes first.
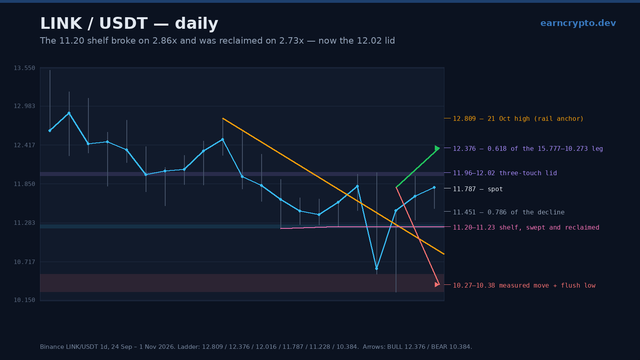
LINK Daily Analysis — The 11.20 Shelf Broke on 2.86x and Was Reclaimed on 2.73x: The 12.02 Lid Decides 12.38 or 10.38
Chainlink swept the 11.20 shelf on 2.86x volume, reversed the whole break on 2.73x and now fights a three-touch 11.96-12.02 lid. 12.02 decides 12.38 or 10.38.