
SUI Daily Analysis — A 1.2947 / 1.2921 Two-Touch Top Rejected on 1.63x Volume: The 1.0922 Neckline Decides 1.3326 or 0.8897
SUI's 1.2921 retest closed 9.6% off its high on 1.63x volume, and the bounce now caps under the 0.618 fib while the 1.0922 neckline decides 1.3326 or 0.8897.
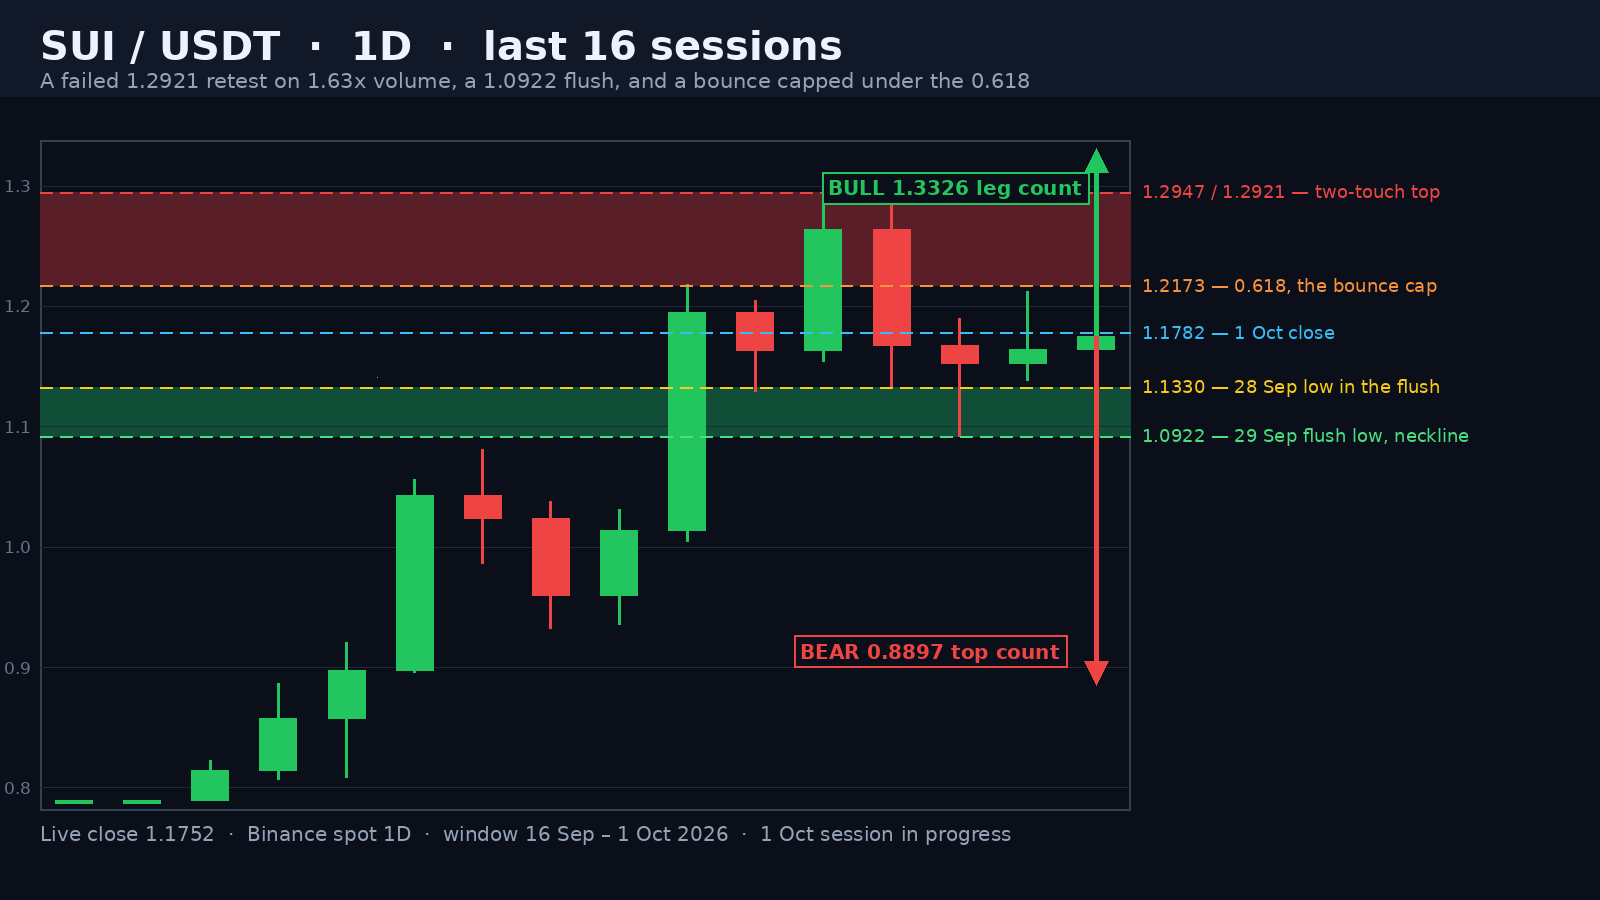
SUI is trading at 1.1784 in the 1 October session, 8.98% under the 1.2947 high it printed on 27 September and 7.9% above the 1.0922 flush low from two sessions later. In between sits the cleanest two-touch top on the board this week — and the tape has already tested and rejected it once. Today's range so far is 0.0359, 3.05% of spot, on a 0.15x full-day volume pace against the 20-day average of 107,245,361 SUI.
Two Sessions, One Ceiling: 1.2947 and 1.2921
27 September printed 1.2947 — the top of a 40-session run from the 0.6354 low of 18 August, a 103.8% advance — and closed at 1.2640. The next session opened at 1.2639, poked 1.2921, and closed at 1.1677. That close was 9.6% off the high. The volume behind it was 174,511,157 tokens against a 20-day average of 107,245,361 — 1.63x — and the heaviest print since 21 September's 239,682,687. A 0.0026 gap between the two highs, 0.2%, printed on consecutive sessions and rejected the second time on rising volume is as clean a double top as the daily chart produces.
Advertisement
What followed confirmed it. 29 September took SUI to 1.0922 — 15.5% under the previous session's high — and it closed the day back at 1.1525. That is a 0.2025-point flush in a single session, inside an asset whose 14-day average true range is 0.1093. Two full average days of range, delivered in one.
The Bounce Has Been Capped Twice, Both Times Under a Fib
From 1.0922 the recovery is now three sessions old. The lows are rising: 1.0922, then 1.1383 on 30 September, then 1.1552 in the current session. The highs are falling: 1.2921, then 1.2124, then 1.1911. Retrace the 1.2947 to 1.0922 flush and the bounce has stopped short of the same two levels both times — 30 September's 1.2124 missed the 0.618 at 1.2173 by 0.0050, and the current session's 1.1911 is sitting just under the 0.5 at 1.1934. From 1.1784 the recovery has retraced 43% of the flush. Three rising lows against two falling highs is the same converging shape the majors are showing — but this one is happening 9% under a blow-off top rather than at a fresh high.
Advertisement
1.0922 Is the Whole Trade
The BULL case: hold the rising lows, close back above 1.2124, and the 0.618 at 1.2173 comes first, then the 1.2921 / 1.2947 two-touch top. A daily close above 1.2947 cancels the double top outright and turns the 21 to 28 September range — 1.0922 to 1.2947, 0.2025 points — into a measured move to 1.4972. The nearer target is the recovery leg itself: 1.0922 to 1.2124 is 0.1202, and projecting that from 1.2124 gives 1.3326.
The BEAR case: lose 1.1552, then 1.1330, and the 1.0922 neckline is the last shelf standing. A daily close below 1.0922 confirms the double top and its 0.2025 height projects 0.8897, with the 25 September low at 1.0050 and the 22 August high at 0.9540 as the obvious way stations. The invalidation is two numbers: a daily close above 1.2947 kills the top, a daily close below 1.0922 kills the recovery. Everything in between is a market deciding.
Context: A 9.3% Average Daily Range
SUI is 22.9% above its 20-day average at 0.9590 and 41.4% above the 50-day at 0.8335. The 7-day change is +15.9% and the 30-day is +62.8% — the strongest 30-day return of the twelve majors. ATR(14) is 0.1093, or 9.3% of spot. That last figure is the one to hold on to here: one average day in SUI covers roughly three times the distance between the close and the 1.2124 ceiling, which is why a stop placed a few ticks above a level in this chart is not a stop at all.
The chart above freezes the last 120 daily sessions from Binance spot. SUI is up 63% in a month, has just printed its heaviest distribution candle of that run, and is now hugged between a falling 1.2124 ceiling and a rising 1.0922 floor. The honest read is that the impulse is intact above 1.2124 and under repair below 1.0922 — and that everything between those two numbers is noise from a 9.3% average daily range.
Written by
EarnCrypto.dev Editorial
The EarnCrypto.dev editorial team researches and reviews AI mining platforms, pools and earning tools — publishing only what passes our own checks.
Related reading

SOL Weekly Analysis — A 17-Week Doubling Topped Twice at 124.95 / 123.76: The 116.32 Neckline Decides 124.95 or 100.19
SOL doubled 107.8% in 17 weeks into a 124.95 / 123.76 two-touch top and paid its 108.29 count to 105.71. The 116.32 neckline decides 124.95 or 100.19.

AVAX Weekly Analysis — A 55.2% Thrust and Four 2x-Volume Weeks Under a 12.008 Two-Touch Top: The 10.866 Retrace Decides 14.25 or 8.387
AVAX ran a 55.2% week on 2.27x volume, then coiled four weeks under an 11.799 / 12.008 two-touch top. The 10.866 line decides 14.25 or the 8.387 count.

ETH Daily Analysis — A 2,392.96 Count 94% Filled and Five Rising Lows Back at the 0.382: The 2,635 Line Decides 2,777 or 2,406
ETH's 2,807/2,600 distribution left a 2,392.96 count that went 94% filled at 2,406.11. Five rising lows have retaken the 0.382 — 2,635 decides 2,777 or 2,406.