
SOL Daily Analysis — Five Higher Lows Into the 120.00 Round Number Under a 123.76 Lower High: The 120.00 Line Decides 128.6 or 116.32
SOL has five higher lows into 120.00 under a 123.76 lower high, and the 116.32-124.95 wedge closes within three sessions. 120.00 decides 128.6 or 116.32.
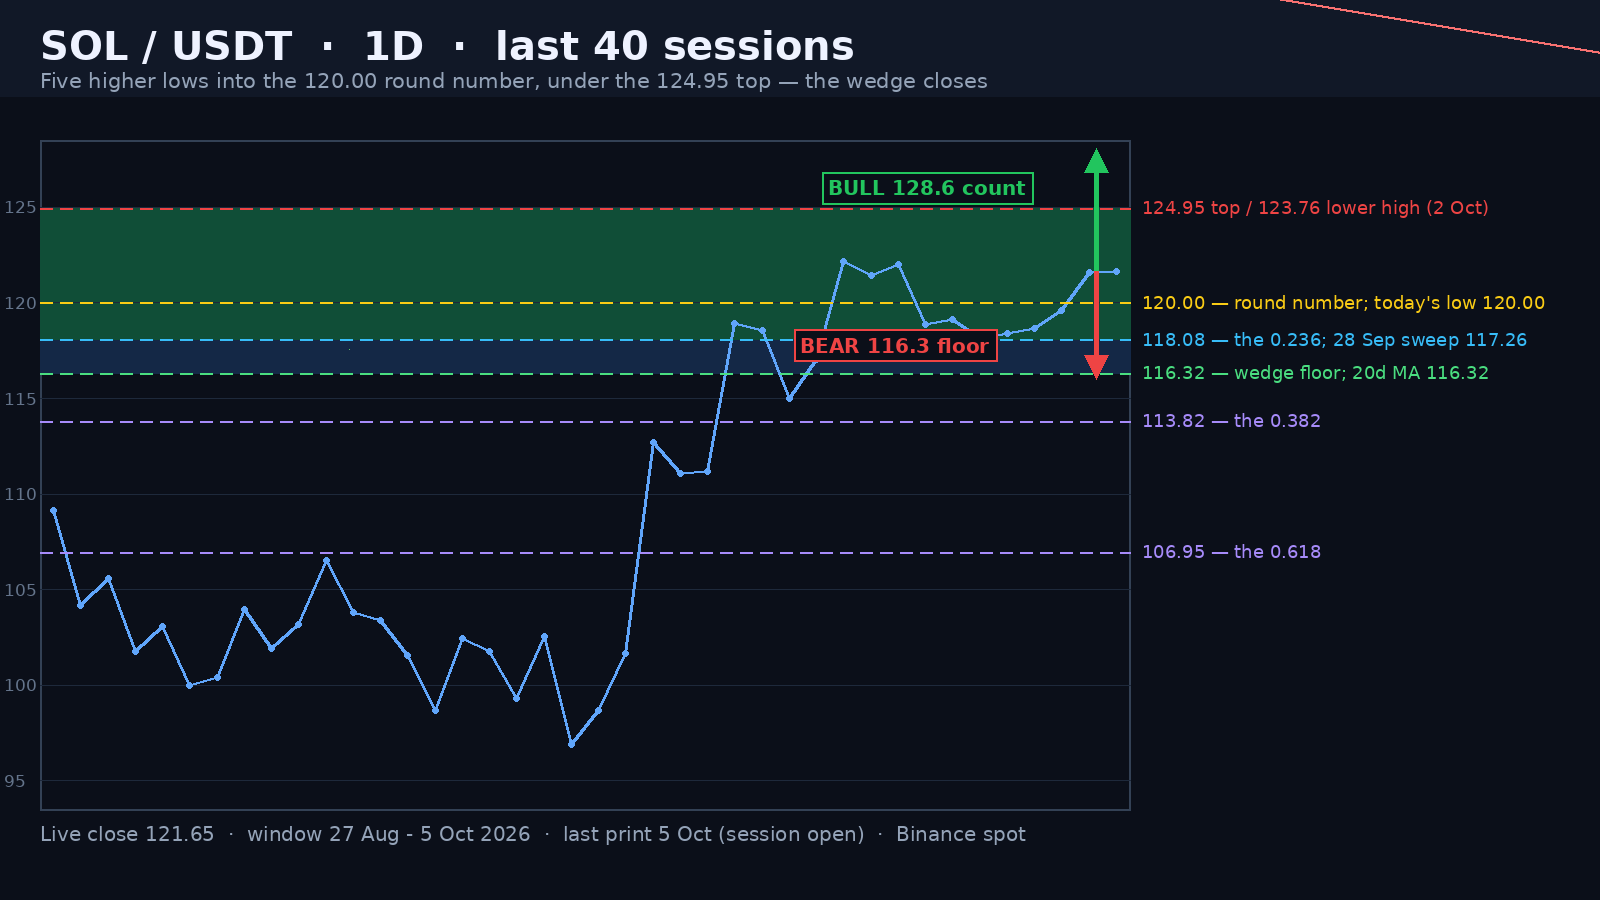
Solana is trading at 121.68 in the opening hours of the 5 October session, 2.62% under the 124.95 high of 27 September and 27.0% above the 95.82 low of 15 September that started the leg. Today's range is 1.82 points, 1.50% of spot, on a 0.21x full-day volume pace against the 20-day average of 2.71 million SOL — a coin that has spent five sessions climbing on almost nothing. The number that matters is the round number: today's low printed exactly 120.00, the fifth consecutive higher low on this leg, and the 20-day average at 116.32 sits on the floor of the pattern.
Five Higher Lows, and a Round Number That Used to Be Resistance
Since 1 October the lows read 116.73, 117.11, 118.52, 119.59 and 120.00 — five consecutive higher lows, each one stepping 0.38 to 1.41 points above the last. That is a floor being defended on falling volume: the last four sessions have printed 1.19x, 0.33x, 0.46x and 0.21x their 20-day average. The striking part is where the floor sits: 120.00 is the same round number that rejected the market on 21 September, when the high printed 119.99 and closed 118.90. A level that was supply two weeks ago is now being defended to the cent, which is what a change of character looks like before it becomes obvious on the chart.
Advertisement
The 0.236 Retrace Held — a Sweep to 117.26 and a 3.8% Recovery
Our 28 September note on Solana put the 118.08 retracement of the 95.82 - 124.95 leg — the 23.6% level — as the line that would decide the next move, with 113.82 below it. The market did both things in three sessions: it swept 0.82 under the level to 117.26 on 28 September, closed back above it at 118.89 the same day, then slid to 116.32 the next session before reclaiming. Since that low the market is 4.6% higher, and the 23.6% level at 118.08 has not closed below since. That is the difference between a correction and a trend change: the sweep took the stops, and the closes stayed on the right side.
124.95 and the 123.76 Lower High — Two Lines Converging
The ceiling is more honest than the floor about how much room is left. The 124.95 high of 27 September printed on only 0.96x the 20-day average — no volume behind it — and the next attempt, on 2 October, reached 123.76 on 1.19x and failed 1.19 points short. From there the arithmetic is simple: the ceiling has fallen 0.24 points a session from 124.95 to 123.76, while the floor has risen 0.82 a session from 116.73 to 120.00. Extend both lines and they collide at 122.33 in roughly three sessions — around 08 Oct. A wedge that narrow does not stay unresolved; it is the reason today's 120.00 print matters more than the price.
Advertisement
What Each Side Needs
The bull case is a daily close above 123.76 — the 2 October lower high and the last real supply before the top. That puts 124.95 back in play, and a confirmed break of it measures 8.63 points from the 120.00 line, projecting 128.63; the 110.38 retracement of the original leg sits well under it, while the 126.54 band our 28 September note flagged is the partial target on the way. Momentum is not stretched: the 14-day RSI reads 56.8, down from 70.3 at the 27 September top, and the 20-day average at 116.32 is 4.6% under spot. The trend structure is intact — higher lows for five sessions, and price 27.0% above the origin of the leg.
The bear case starts with the close under 120.00, because a wick through a round number on thin volume has meant nothing all month. Under it the shelves come quickly: 119.59 from 4 October, 118.52 from 3 October, then the 117.26 sweep low of 28 September before the 116.32 floor — which is where the rising line and the 20-day average at 116.32 meet, so a close under it invalidates the wedge and opens the 113.82 retracement, with the 110.38 level as the measured destination of a full unwind. The 14-day ATR is 4.50 points, 3.7% of spot, which means one average session can cover 117.18 to 126.18 on its own: on this volatility the close, not the intraday print, is the only signal worth acting on.
Written by
EarnCrypto.dev Editorial
The EarnCrypto.dev editorial team researches and reviews AI mining platforms, pools and earning tools — publishing only what passes our own checks.
Related reading

SOL Weekly Analysis — A 17-Week Doubling Topped Twice at 124.95 / 123.76: The 116.32 Neckline Decides 124.95 or 100.19
SOL doubled 107.8% in 17 weeks into a 124.95 / 123.76 two-touch top and paid its 108.29 count to 105.71. The 116.32 neckline decides 124.95 or 100.19.

AVAX Weekly Analysis — A 55.2% Thrust and Four 2x-Volume Weeks Under a 12.008 Two-Touch Top: The 10.866 Retrace Decides 14.25 or 8.387
AVAX ran a 55.2% week on 2.27x volume, then coiled four weeks under an 11.799 / 12.008 two-touch top. The 10.866 line decides 14.25 or the 8.387 count.

ETH Daily Analysis — A 2,392.96 Count 94% Filled and Five Rising Lows Back at the 0.382: The 2,635 Line Decides 2,777 or 2,406
ETH's 2,807/2,600 distribution left a 2,392.96 count that went 94% filled at 2,406.11. Five rising lows have retaken the 0.382 — 2,635 decides 2,777 or 2,406.